BTC/USD technical analysis 📊
Real trades. Real lessons. No guaranteed calls.
Liquidity • Market structure • Trading psychology
Live analysis on YouTube ↓
₿ Bitcoin doesn't owe you a trade.
I share real BTC/USD analysis, liquidity levels, market structure and trading psychology.
No crystal balls. No guaranteed calls. Just honest analysis, wins and losses.
Follow for daily BTC insights. 📊
A liquidity sweep isn't the same as a breakout.
Example: BTC wicks above $65,000, triggers stops, then closes back below. That can signal rejection, not strength.
I mark the swept high and watch whether price reclaims it. The close matters more than the wick.
#BTC#Trading
BTC market map: $64,000 is the overhead reference; $62,030 the prior swing low (19 Nov chart, not live).
Above $64k, I'd assess whether buyers can sustain a recovery. Below $62,030, downside risk increases. Between them? Still a contested range, not a trend.
#Bitcoin
BTC's bounce from $62,030 to nearly $64,000 has faded.
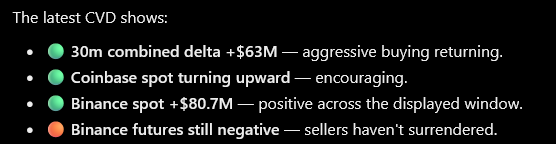
The key distinction: a price recovery isn't necessarily a demand recovery. If spot CVD keeps falling while price rises, passive absorption may be involved, but it doesn't prove a bottom. Genuine buyers today!
#Bitcoin#BTC
BTC's bounce from $62,030 to nearly $64,000 has faded.
The key distinction: a price recovery isn't necessarily a demand recovery. If spot CVD keeps falling while price rises, passive absorption may be involved, but it doesn't prove a bottom.
#Bitcoin#BTC
BTC can rise while perpetual CVD falls.
Aggressive sellers may be hitting bids, but passive buyers are absorbing that pressure.
That's potentially significant, not proof of a bottom. I compare spot CVD, open interest and price response before drawing conclusions.
#BTC#Bitcoin
A Bitcoin order block isn't automatically a support or resistance level.
After a sharp move, I mark the last opposing candle before displacement. But the real test is whether price reacts when it returns.
Some blocks never get retested. Others fail immediately.
#Bitcoin
Rising Open Interest does NOT mean more traders are going long!
Every futures contract has both a buyer and a seller. Rising OI means more contracts are open, not that Bitcoin is bullish
Combine OI with price action, CVD and liquidations to understand who's gaining control
#BTC
Bitcoin's overnight range is my first map, not a price prediction.
I mark the Asian session high and low. A London break that quickly returns inside the range can signal a liquidity sweep rather than a breakout.
The key is where price holds after the move.
#Bitcoin#BTC