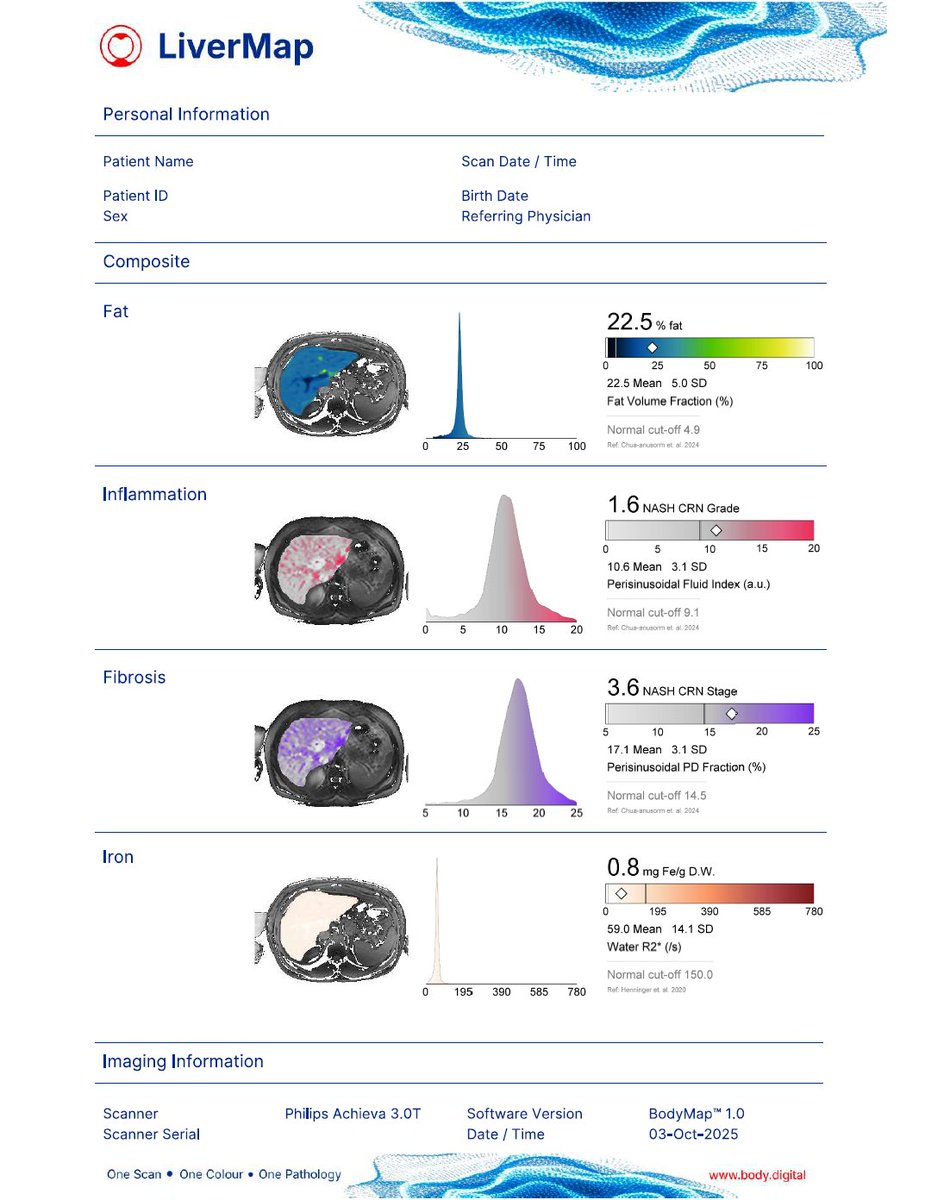
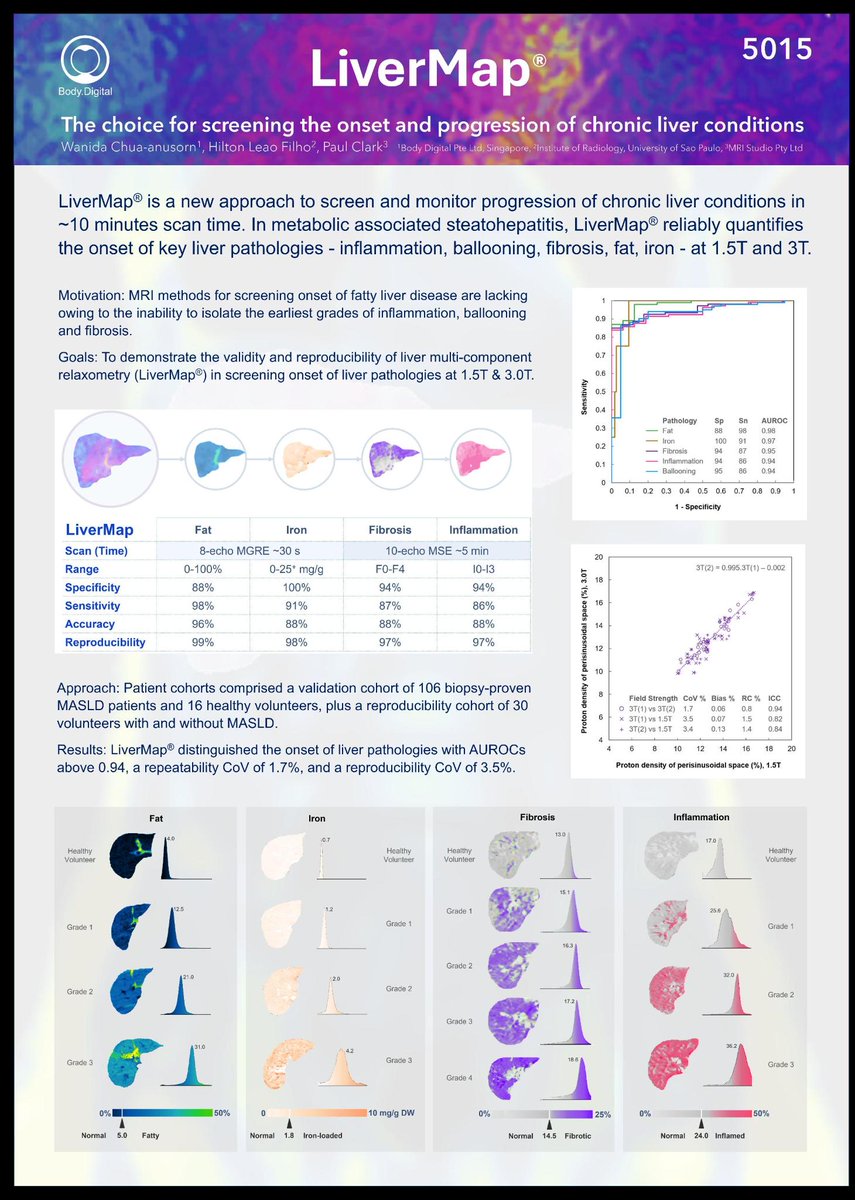
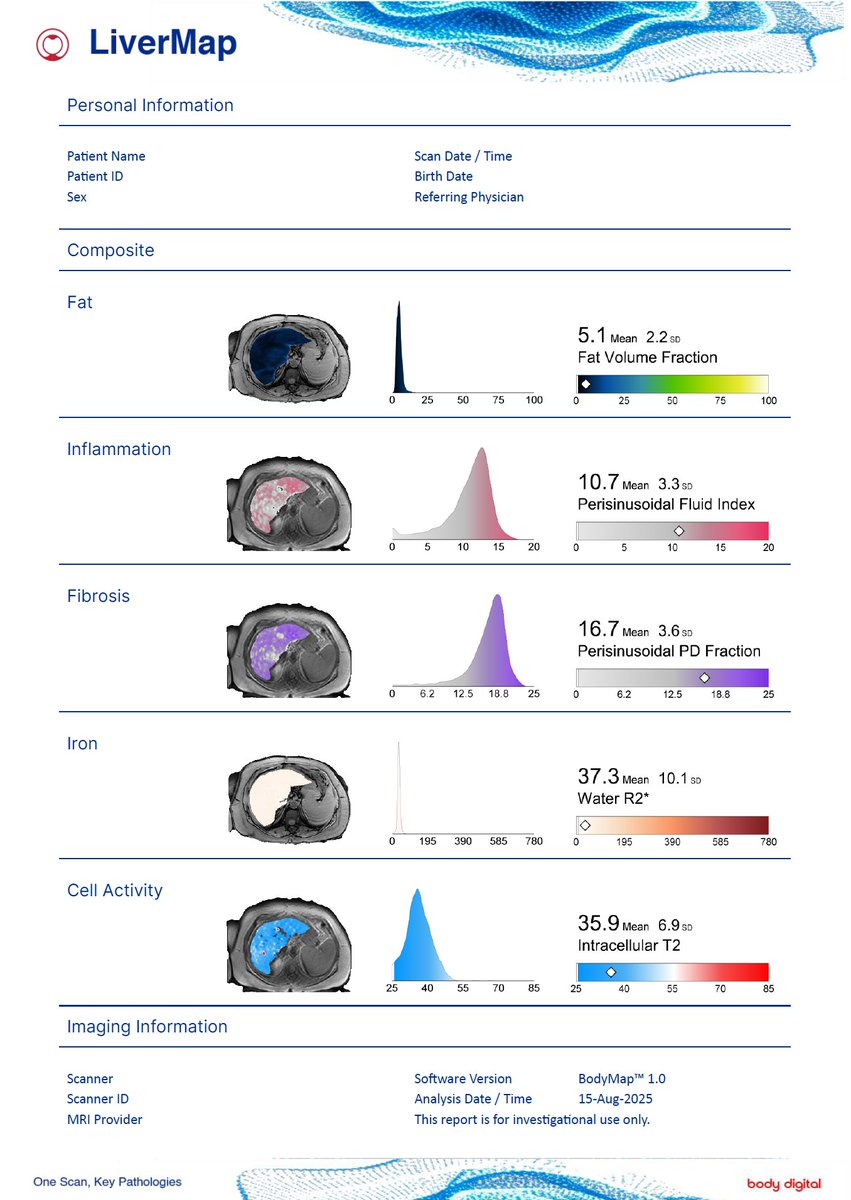
#BodyDigital#LiverMap demonstrates how #MRI multi‑component relaxometry can quantify #fibrosis, #inflammation, and #steatosis in fatty #liver disease from a ~10‑minute scan.
Terrific collaboration across Brazil 🇧🇷and Australia 🇦🇺.
https://t.co/0fVcTbMfum
#BodyDigital#BATMap: In contrast to PET, BATMap isolates canonical “browned” #fat depots and maps brown→beige→white fat phenotypes — no tracer, no ionising radiation. Brown fat cells burn stored fats to generate heat, supporting glucose control and healthier metabolic balance.
#BodyDigital#Fat Metabolism: Brown fat has higher polyunsaturated fatty acids (PUFA) — a hallmark of healthier metabolic function. Yet in #MRI, this biochemical shift nudges the fat signal by only ~1%, hidden in the bis‑allylic fat spectral peak. #BodyMap is up to the challenge.
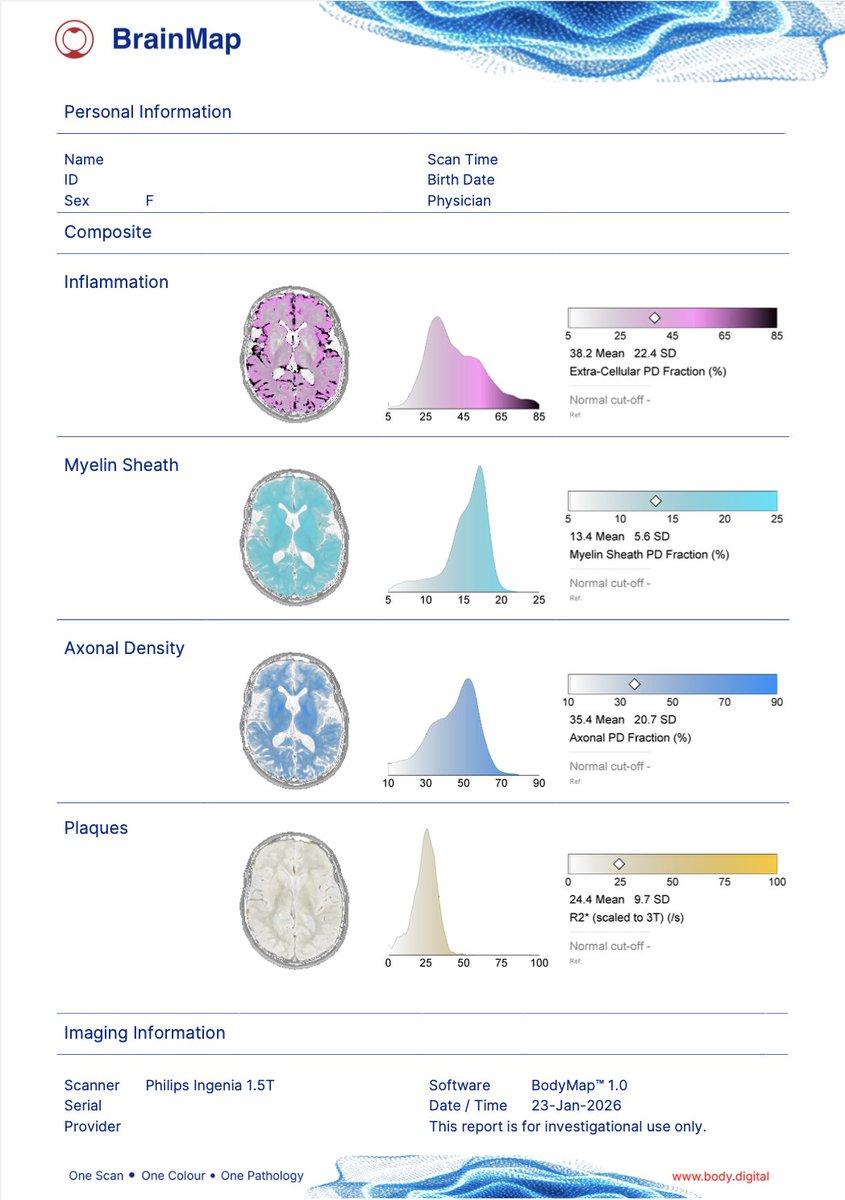
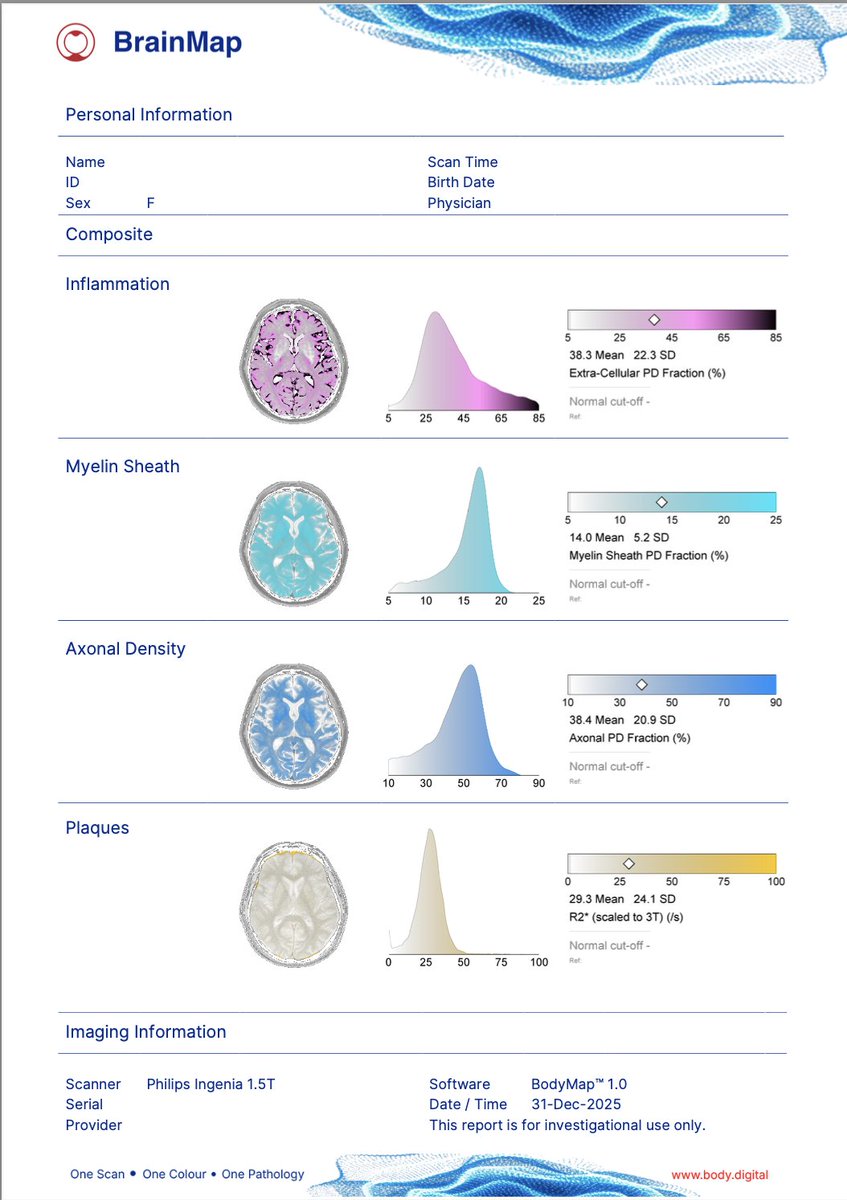
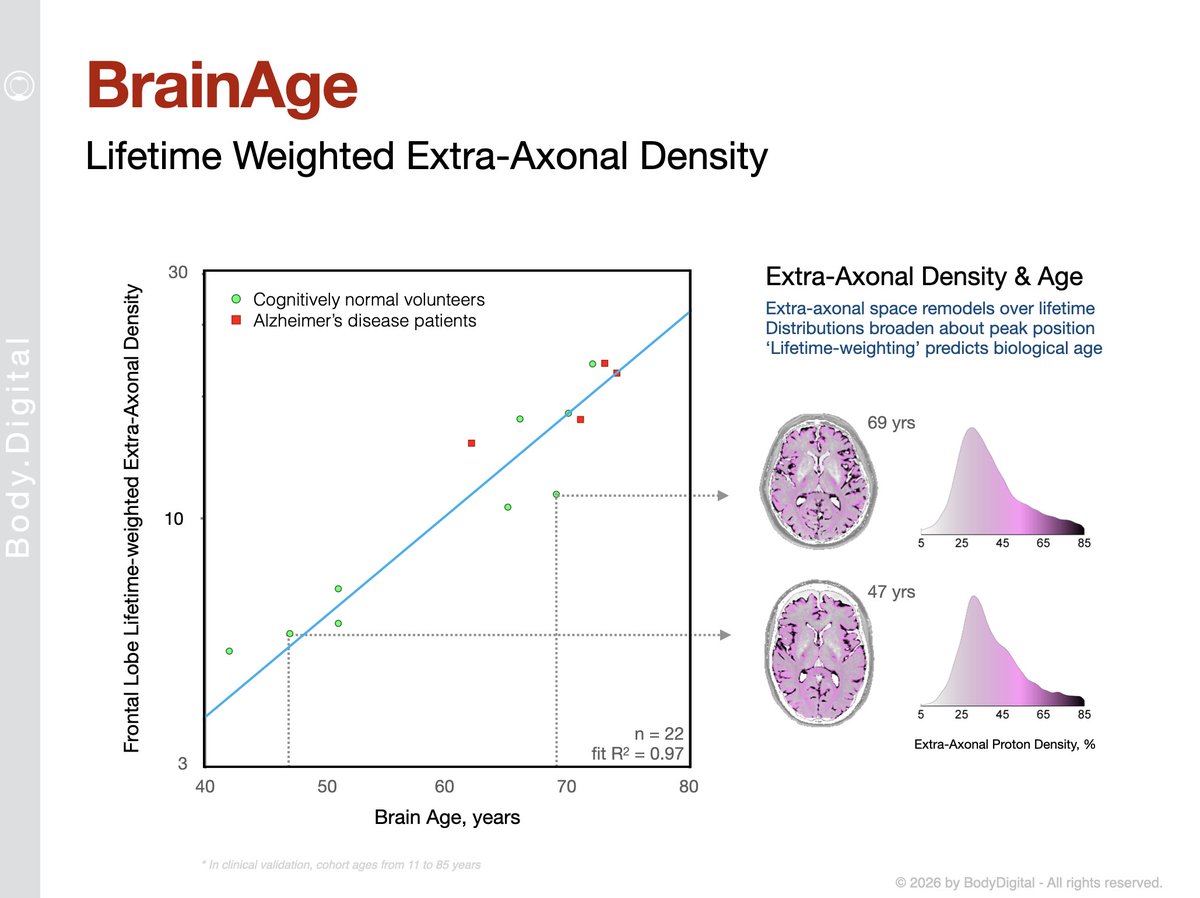
🧠 #BodyDigital#BrainMap: Extra-Axonal Proton Density (EAPD) measured by #MRI has a relatively stable peak in healthy adults, with peak broadening emerging as a hallmark of #aging. 'Lifetime-weighting' on the peak resolves EAPD into a rising predictor of biological #brain age.⌛️
These #BodyDigital#BrainMap reports, left to right, show insula matures later, with #axonal proton density (PD) giving stronger age-descrimnation than #myelin sheath PD. Younger brains also show a lower, tighter R2* peak, reflecting less iron load.🧠Now, who can guess the ages?
#BodyDigital#BrainMap: When metrics match and distributions align, it's the pattern that speaks. Subtle #brain#aging effects - like sulcal widening in the insula - emerge in the micro-architectural maps as changes in extra-cellular space, myelin density, and axonal integrity.🧠
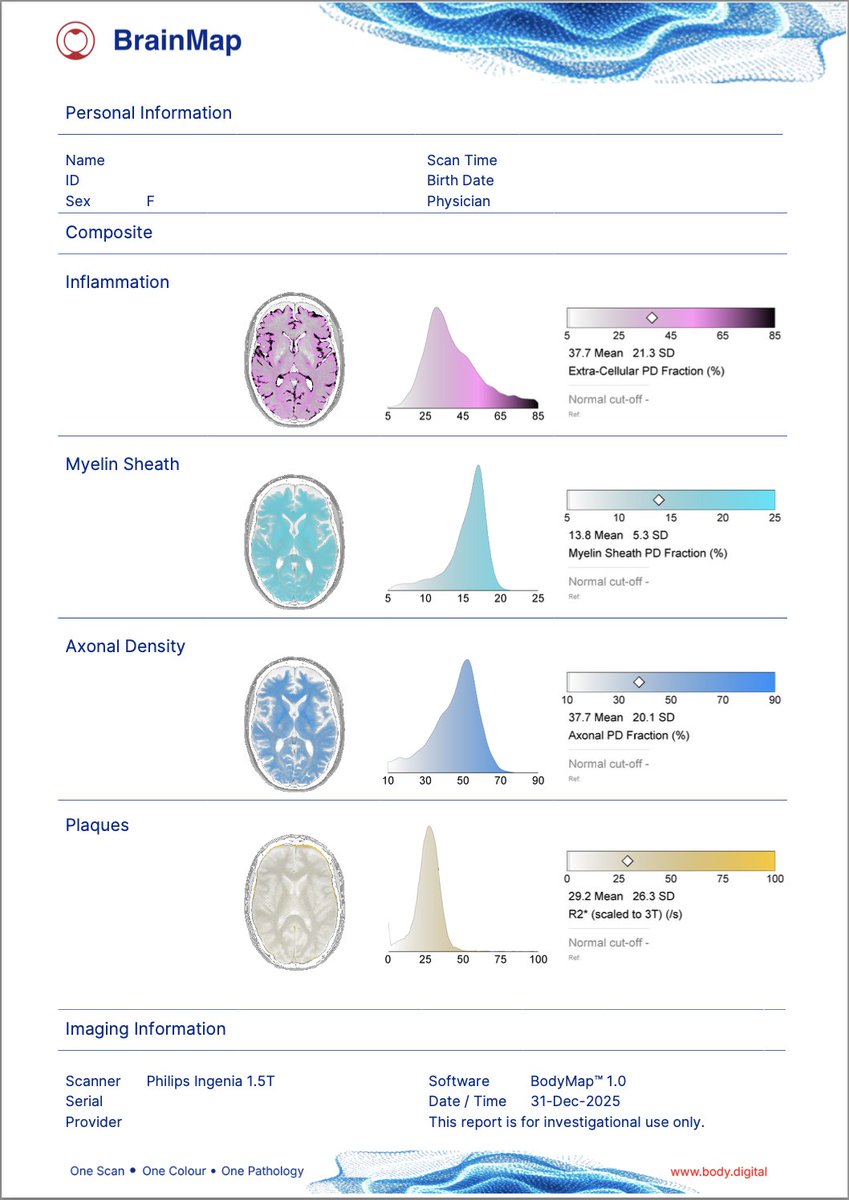
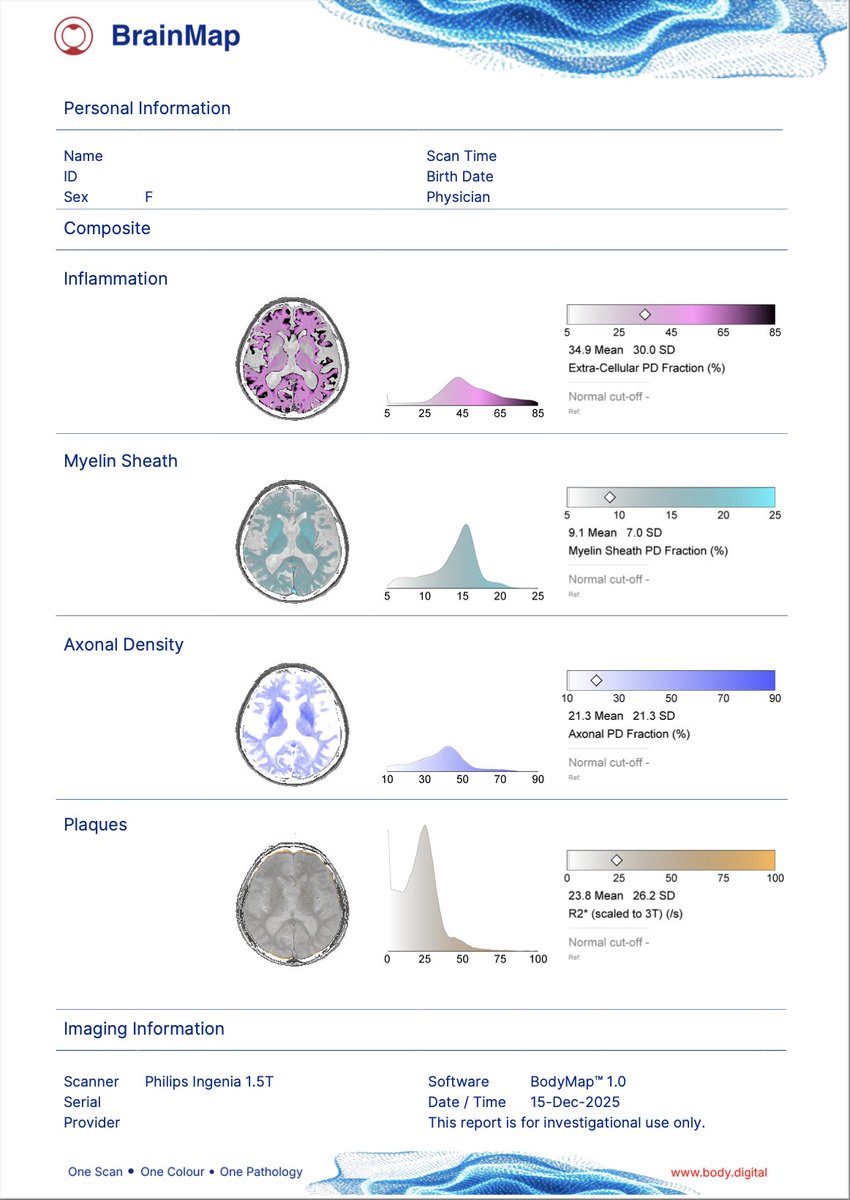
#BodyDigital#BrainMap: making neurodegeneration visible, in color. Healthy aging brains look "filled-in" —bright axons, intact #myelin, muted #inflammation. In #Alzheimers disease those colors fragment — clear regions expand as visible gaps in tissue volume. #MRI#BrainHealth 🧠
#BodyDigital#BrainMap: early onset #Alzheimer's versus an age-matched healthy volunteer. Neuro-degeneration presents with elevated #inflammation, reduced #myelin content and loss of #axon integrity in frontal lobe white matter, with increased #plaques evident in the putamen.
#BodyDigital#BrainMap: Mapping #infalmmation, #myelin content, #axon density, and #plaques in under 10 minutes scan time. Here, a baseline BrainMap report for a healthy volunteer, showing ROIs for frontal lobe white matter myelin, and an absence of plaques in the putamen (+). 🧠
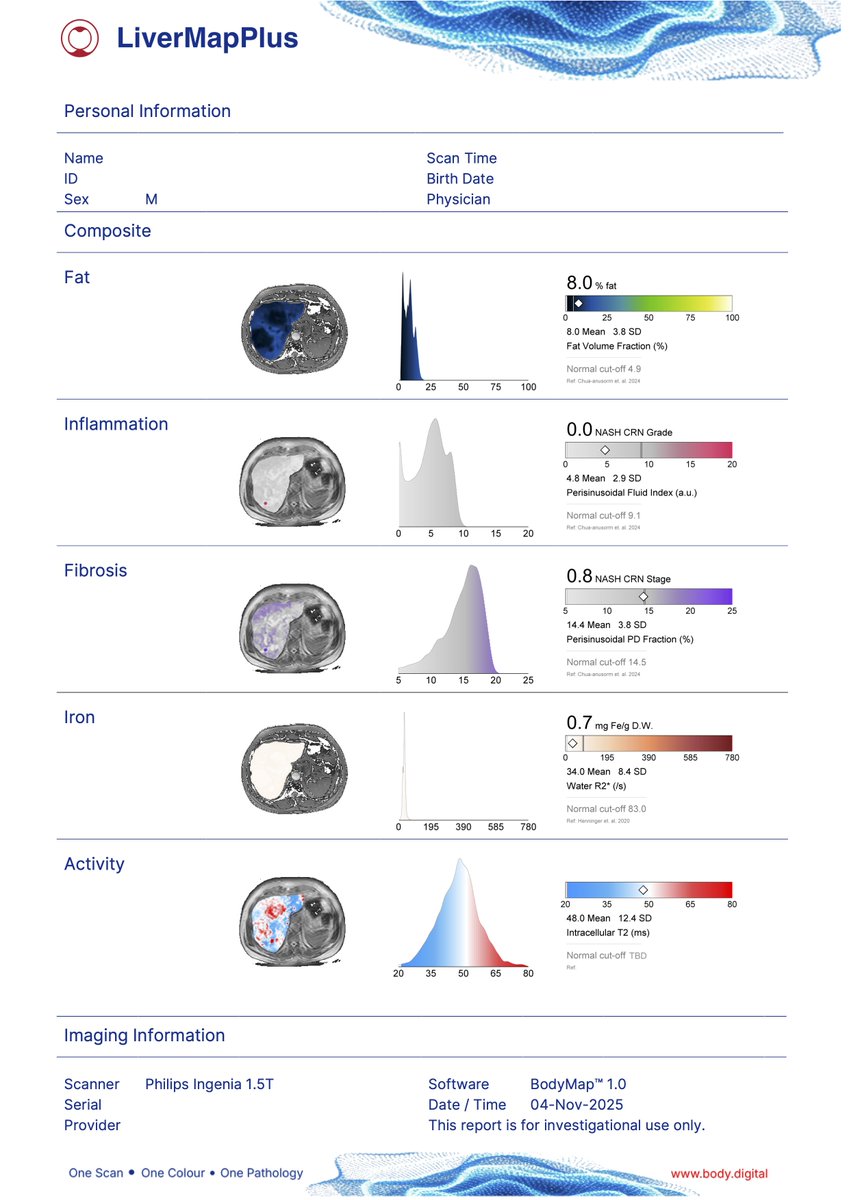
#BodyDigital#LiverMapPlus: Intracellular #T2 mapping reveals #cancer#cell activity. #Liver#metastases show elevated T2 from healthy, increased T2 heterogeneity, and clear necrotic regions—reflecting increased membrane permeability and mobile water in #malignant cancer cells 🔬
#BodyDigital#LiverMap: In a setting of very high #liver#fat, before sequestration capacity and hepatocyte function decline, preserved cells can still mount a strong #inflammation response alongside advancing #fibrosis — a profile of active, progressive #NASH 🧐
#BodyDigital#LiverMap: With persistently high levels of #liver#fat, progressive fibrosis can alter the liver’s capacity to mount a robust inflammatory ‘healing’ response, so that only mild #inflammation may be observed in the setting of advance #fibrosis. 🔎
#BodyDigital#LiverMap: Regional increase in #liver#fat in fatty liver disease is associated with increased fibroinflammatory activity above normal (here in the right lobe of the liver), even when global measurement of #inflammation and #fibrosis is within normal.🧐
#BodyDigital#LiverMap: Sensitivity and reproducibility are essential to understand when our #liver is healthy and when it is not, no matter where we have an #MRI.
#BodyDigital#LiverMap: Low-borderline #liver#fat fraction alongside severe #inflammation/#fibrosis is common in advanced fatty liver disease — fat can regress as scarring and injury progress. Normal liver fat alone doesn't mean your liver is normal. 🧐
🧠 Brain Age Prediction ⏳ #BodyDigital#BrainMap extracellular space mapping reveals the pattern of #brain development and decline from #aging and inflammation. 'Lifetime-weighting' on this pattern gives a linear predictor of brain age. How old is your brain?