Railroads were once 63% of the entire US stock market.
Not 63% of transport stocks. 63% of everything listed.
The history of concentration, in order:
– Tulips, 1637. A single bulb traded for the price of an Amsterdam canal house.
– South Sea Company, 1720. Shares went from about £128 in January to above £1,000 by summer, then back near £150 by December.
– US railroads, 1840s. 63% of US market cap.
– Utilities, telecom and industrials, 1929. 36%.
– Nifty Fifty, 1972. 40%.
– Japan, 1989. 44% of global equity.
– Dot com, 2000. 41%.
– AI Big 10, today. About 40%.
Every one of them was built on something real. Railroads did compress a continent. The internet did rewire commerce. Being right about the technology was never the thing that protected you.
The tulip story is also less clean than the legend. Modern research found the economic damage was modest and the ruin was mostly literary.
The bubble was never in the idea. It was in how many people decided to own the same idea at the same time.
It is becoming increasingly obvious that the AI data centre buildout is just subsidising the cashflows of the other companies. Baron Von Munchausen market! 📈📉
I mean, Jesus...
That last clause deserves a picture, because most people underestimate it badly.
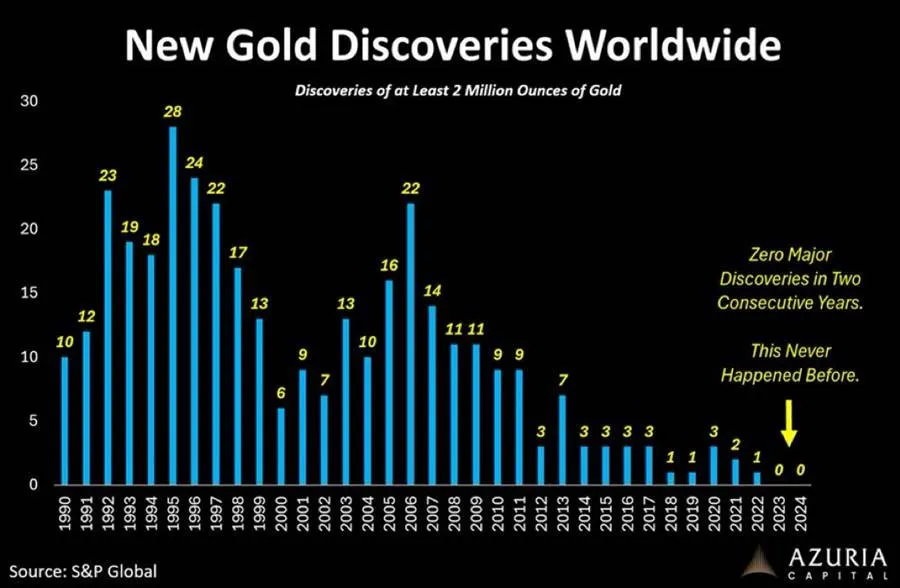
New gold discoveries worldwide — deposits of at least two million ounces, by year.
The industry found twenty-eight major deposits in 1995. It found three in 2014, one in 2022, and then nothing at all in 2023 and nothing at all in 2024 — the first back-to-back blank years since the series began.
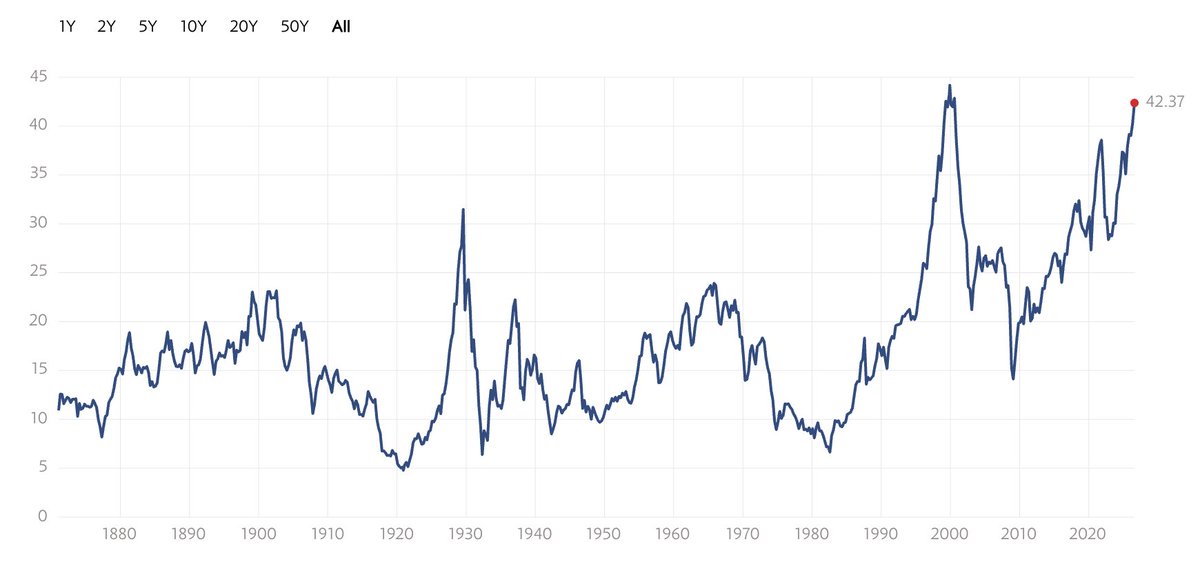
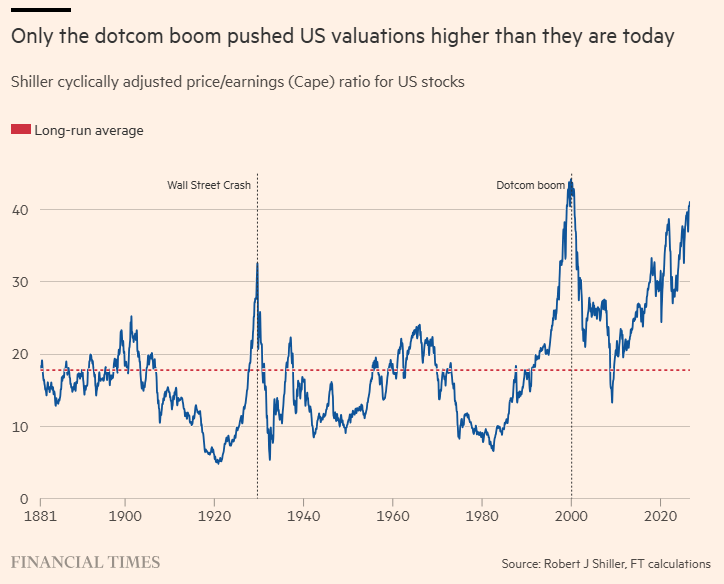
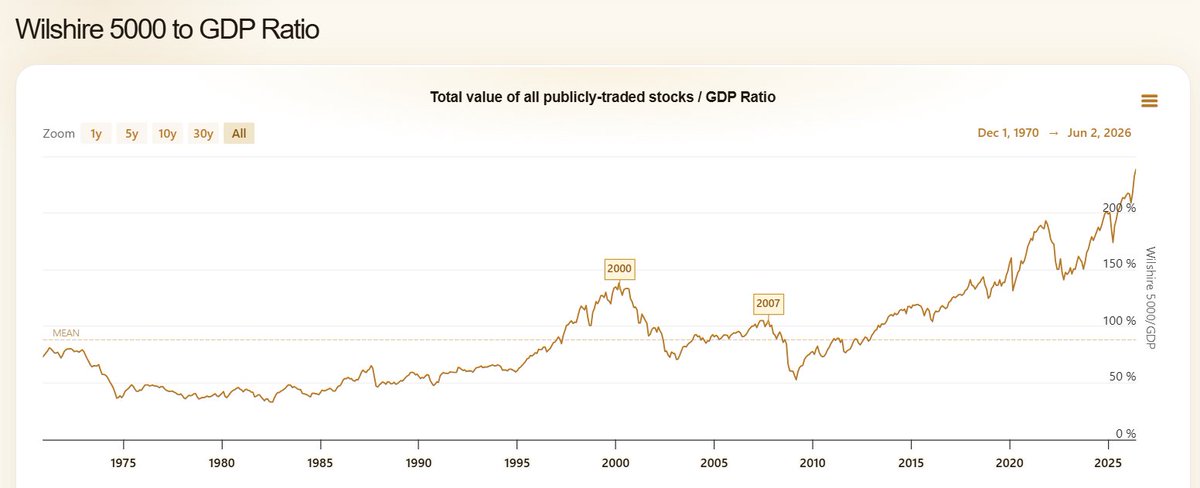
The stock market is now at its 2nd most expensive valuation ever, far above the levels seen in the 1929 crash and only slightly below the Dot-Com bubble. Euphoria is clearly back.
Tech beat energy into 2000. Energy beat tech into 2008. Tech beat energy into 2020.
One ratio. One winner at a time. Thirty years of taking turns, because a long duration asset and the inflation itself do not get paid by the same thing.
In 2026 both are at the top of the leaderboard. Tech up about 33% this year. Energy right behind it.
The question is not which sector is stronger. It is which one is priced wrong.
It is supposed to be hard
Since I love statistics, here are two things to keep in mind when picking stocks. First, over the last 100 years, only 4% of stocks have been responsible for the total gains of the entire stock market. Second, 48% of all stocks are just equivalent to the performance of a one-month US Treasury Bill.
This begs the question, what are the characteristics of the 4% of stocks that create all the value? Is it not the case that to do well, they tend to hit new highs, otherwise how could they do well?
I would like to quote Chris Mayer, the author of «100 Baggers: Stocks that Return 100-to-1 and How to Find Them», a highly recommended book. He was referring to the frequently asked question that you should not buy stocks at their 52-week highs, but wait for dips.
«One thing my study of 100-baggers taught me – and this is intuitive anyway, if you think about it – is that the best performing stocks spend most of their time near 52-week highs. It makes sense. A stock that is a great performer over a long period of time – the exact kind of stock you want to own – is a stock that is putting in new 52-week highs fairly regularly: a beautiful long-term chart that is up and to the right.
How else could it be a great performer?
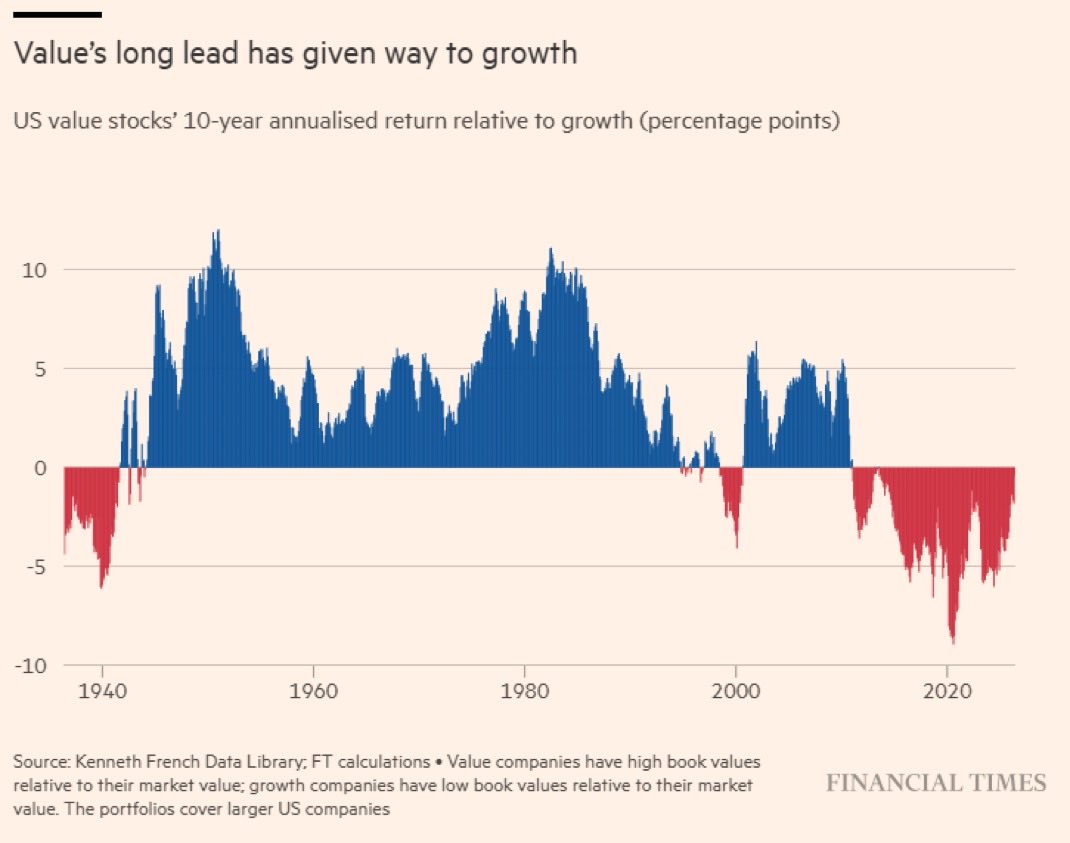
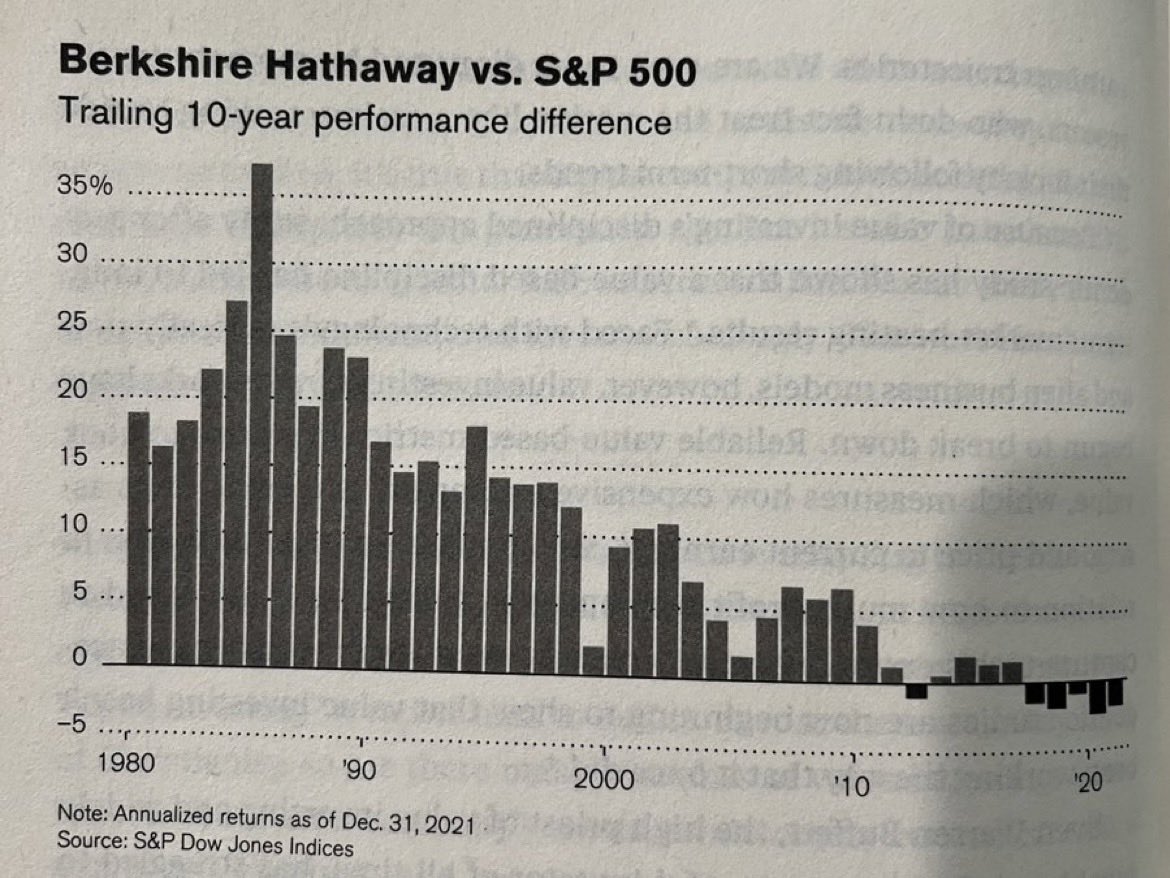
Berkshire beat the S&P 500 by 36 points a year over the ten years to 1985. Over the ten years to 2021, it lost to it. The edge did not collapse. It shrank for four decades, one bar at a time.
Buffett did not get worse. He got bigger, the market got more efficient, and the thing he refused to own became a third of the index.
Every edge is temporary. The ones that fade slowly are the hardest to notice.
The Economist picked a good week to do a "currency" cover --
and for what it is worth, the big Mac index agrees with my own work, the yuan is undervalued by something like 30%
1/
A look back at the stocks that traded above 10x sales at the dot-com peak.
What happened next:
– Cisco: ~25x sales, P/E above 200. Crashed -90%. Finally broke its 2000 peak in December 2025. 25 years and 8 months later.
– Intel: ~13x sales. Crashed -82%. Finally broke its 2000 peak in May 2026. Almost exactly 26 years later.
– Microsoft: ~25x sales. Crashed -65%. Took 16 years and 8 months to make a new high (October 2016).
– Qualcomm: ~30x sales. Crashed -88%. Took roughly 20 years to break even.
– Sun Microsystems: ~10x sales. Crashed -97%. Acquired by Oracle in 2009.
– JDSU: ~50x sales. Crashed -99%. Broken into pieces.
– Yahoo: ~50x sales. Crashed -97%. Sold to Verizon for a fraction.
– Lucent: ~10x sales. Crashed -99%. Eventually absorbed by Nokia.
– Nortel: ~15x sales. Bankrupt in 2009.
Then there's the famous mega survivor.
Amazon traded at ~30x sales at the peak. It still crashed -97%. The investor who bought at the top held through a 97% drawdown before eventually making money roughly a decade later.
The lesson isn't that every 10x sales stock ends in zero.
It's that even the eventual winners crash 90%+ first, and break even only after a generation.
Cisco. Intel. Microsoft. Amazon. The four greatest tech survivors of the dot-com era. Average time to break even on price alone: roughly 19 years. Inflation-adjusted, the math is uglier.
You have to be very right, very early, and willing to hold through unimaginable pain.
Most people aren't.