4/ Example #1: Ascending Triangle 🔺
What you see:
• Resistance remains the same
• Every correction becomes smaller creating higher lows
Buyers are becoming aggressive.
Sellers are running out of supply.
Eventually...BOOM 💥 as Resistance breaks
👉Psychology behind Ascending Triangle
Seller:
"I'll sell at ₹100."
Buyer:
"Fine."
👉Next dip?
Buyer again steps in earlier.
Then earlier.
Then earlier.
Eventually sellers disappear.
Price explodes higher
MARKET MECHANICS LESSON:
Why MRVL Crashed Into the Close
Yesterday MRVL ran from ~$305 to ~$329 by mid-afternoon. Then it fell $19 in 10 minutes and crossed at $310.58. No news. No earnings miss. No downgrade. Pure mechanics. Here's what happened and why it matters.
THE SETUP: INDEX INCLUSION ARBITRAGE
When a stock gets added to a major index, passive funds are required to buy it at the closing price on inclusion day. They have no choice. They must own it by the close. Everyone knows this in advance.
Arbitrage firms exploit this. In the days leading up to inclusion, they accumulate shares before the passive funds are forced to buy. Then they sell into the guaranteed demand at the close. The profit is the spread between their entry price and the closing cross.
THE MRVL TRADE:
June 15-17: Arb desks accumulated roughly $20-30B of MRVL inventory through dark pools. Blended cost: approximately $290-300.
Yesterday morning: MRVL ran from $305 to $329. Momentum traders and short-covering piled in ahead of the inclusion print. The arbs sat on their inventory and watched the price rise. Every dollar higher was additional profit on their position.
3:50 PM: The MOC (Market on Close) imbalance feed published. This is the official number that tells the market how much net buying the passive funds need at the close. The imbalance indicated $5-8B of net buying needed.
THE PROBLEM: The arbs had $20-30B of inventory to sell. The passive funds only needed $5-8B. There were 3-4x more sellers than buyers.
3:50-4:00 PM: The arbs recognized the mismatch instantly. They started selling aggressively on the lit order book to clear inventory before the close. They couldn't wait for the 4:00 PM cross because there wasn't enough passive demand to absorb their full position. MRVL dropped from $327 to $310 in 10 minutes.
4:00 PM cross: $310.58. The passive funds got their full allocation at this price. The arbs unloaded the bulk of their inventory. Still profitable. They bought at $290-300 and sold at $310. But significantly less profitable than $327.
4:01-4:14 PM: The remaining $10B+ of residual inventory cleaned up through dark pool and swap structures at the official close mark.
THE OPTIONS TELL:
At 3:33 PM, with MRVL trading at $327.62, someone bought $310 puts expiring that same day for $0.24. Those puts were 5.4% out of the money with 27 minutes until expiration. On any normal day, that's a lottery ticket that expires worthless.
Those puts went deep in the money. MRVL crossed at $310.58. The $310 strike was at the money at the close. A $0.24 option became valuable in 27 minutes because the buyer understood the inclusion mechanics that were about to unfold.
THE LESSON:
This wasn't manipulation. It wasn't a crash. It was the predictable resolution of an arbitrage supply-demand imbalance.
The passive funds created guaranteed demand. The arbs front-ran that demand. The arbs accumulated more inventory than the demand could absorb. The MOC imbalance revealed the mismatch at 3:50 PM. The arbs sold into each other trying to exit first. The price fell to the level where supply met demand.
Every index inclusion event has this dynamic. The magnitude depends on the gap between arb inventory and passive fund demand. When the arbs overestimate the demand (or over-accumulate inventory), the closing cross is violent. When the sizes match, the cross is orderly.
The flow told the story before the price did. The dark pool accumulation over three days mapped the arb inventory. The MOC imbalance at 3:50 PM revealed the mismatch. The options market at 3:33 PM showed someone positioning for the exact outcome. The mechanics were visible to anyone watching the right data.
This is why we track flow, not headlines. The mechanic says: index arbs over-accumulated and the MOC imbalance was too small to absorb them. Same result. Different understanding. Different edge next time.
$MRVL $SMH $QQQ
Nicholas Darvas's 1957-1958 Trade Rating System via "Cause of Error"
Always review your journal, it's the only way to fine tune your process and execution
$BROS (Update) — Breaking out of a 15-month downtrend while completing a 5-year cup and handle pattern on the weekly chart.
We began stalking this setup on June 4, well ahead of the June 10 breakout move. Now let's see how far this trend can run.
"There are two types of stock moves. Magnitude moves and duration moves.
Magnitude moves are moves in which a stock makes a very big, rapid move. The magnitude and speed of the move are critical in this kind of move. Stock goes up 20-50% in just a few days, or makes a triple-digit move in a few weeks.
These are explosive momentum burst moves and are more common.
Duration moves are when the stock keeps going up for a long time. But speed may not be fast. There are stocks that go up slowly in a stair-step fashion.
As a trader, you need to choose which one to focus on, as that has implications for your entries, exits, and sizing.
I only focus on magnitude moves. I have no interest in duration moves.
Let me let you guys in on a secret that can help you catch a lot of these moves before they happen so you're not stuck chasing and holding the bag.
Listen up.
Create a watchlist with the leaders in every sector that's been hot this year.
For example: Photonics, Semis, FAANG, Space, Robotics, Financials, Healthcare, Energy, etc.
Money is constantly rotating between these sectors. Your job is to determine where institutional money is positioned before each session.
Within those sector leaders, you'll have a group of smaller names that align with the same theme.
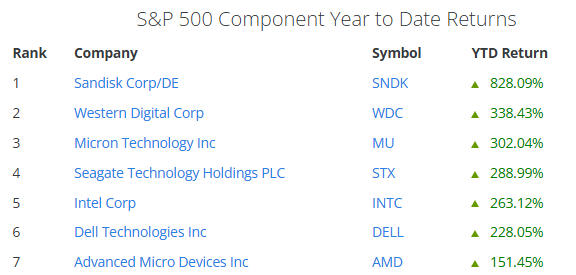
Something that really stood out to me last Friday was how memory names started bidding aggressively despite a weak tape. Those are some of my favorite setups because if the market decides to turn around, those names are usually the first to lead.
Between Thursday and Friday of last week, $SNDK ran from 1670 to 2000+.
While that name can be difficult for traders with smaller accounts to participate in, there are other stocks within the exact same theme that often make aggressive moves shortly after.
My focus immediately shifted to $WDC and $STX.
$WDC ran from 500 to 730 in just 3 sessions (+46%).
$STX ran from 870 to 1100 in just 3 sessions (+26%).
While many traders wait for 10 indicators to trigger before hitting the buy button and end up chasing these moves, there are other ways to get ahead.
The market leaves clues. You just have to know where to look.