Flight canceled at last minute today so stuck in Denver… until Tuesday @Delta . Staff said they ran out of lodging/ food vouchers. Seriously? How is this going to be made right?
@Delta flight cancelled today 7/20, we are stuck in Denver until Tuesday 7/23. Employee told us they ran out of meal/ hotel vouchers. Seriously? What do we need to do?
So proud of my son. His senior season has been a year of change, trust, growth, and a lot of hard work. He has adapted and excelled in all of these.
Life moments that develop a successful/ healthy man.
Excited to see what the Lord has next…knowing 1st that He has you.
@elonmusk@tferriss To some a prison…to others a comfort. Some expand boundaries, while others live within…while both exist within the universal limitation of being finite w/ capacity. Not sure which is the worse sentence…to be content/ peace OR to live in unquenched restlessness…never enough.
@ICannot_Enough Question (I’m a Model 3 owner): how is the ratio of infrastructure (charging stations) growth compared to deliveries? I know it’s increasing…but at a level that can keep up with production? Many new stations with low # spots. Not to mention other companies using infrastructure
What gets lost with some of my charts is the magnitude of just how many more people are buying a Tesla every year. "It's right there on the chart, James, how could we miss it?"... I hear you asking.
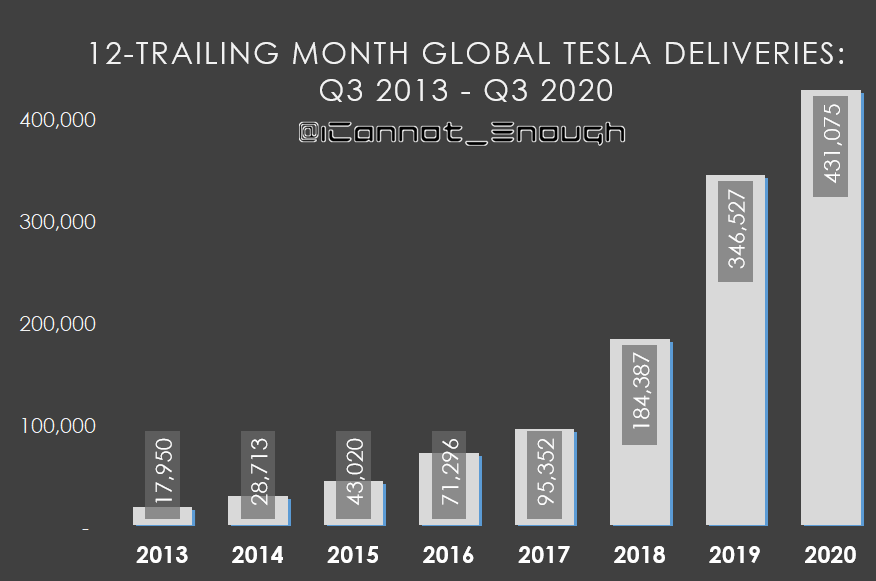
Well, to illustrate what I mean, here's a chart I could have posted 3 years ago yesterday:
Impressive growth, right? Yes. But that's how they all look, with very short bars for the oldest time periods. After a while, the latest updates to these charts begin to visually look the same... because every time the chart is updated, the latest record high reduces the heights of all the bars that came before: the relative magnitude never looks any more impressive, at a glance, than it did the year before.
Without a good frame of reference, it's hard to appreciate how much more Tesla is beating their previous records by.
I'll give just one example: over the past 12 months, $TSLA has increased unit sales year-over-year by >500,000 vehicles. That's more than the tallest bar shown on the chart above.
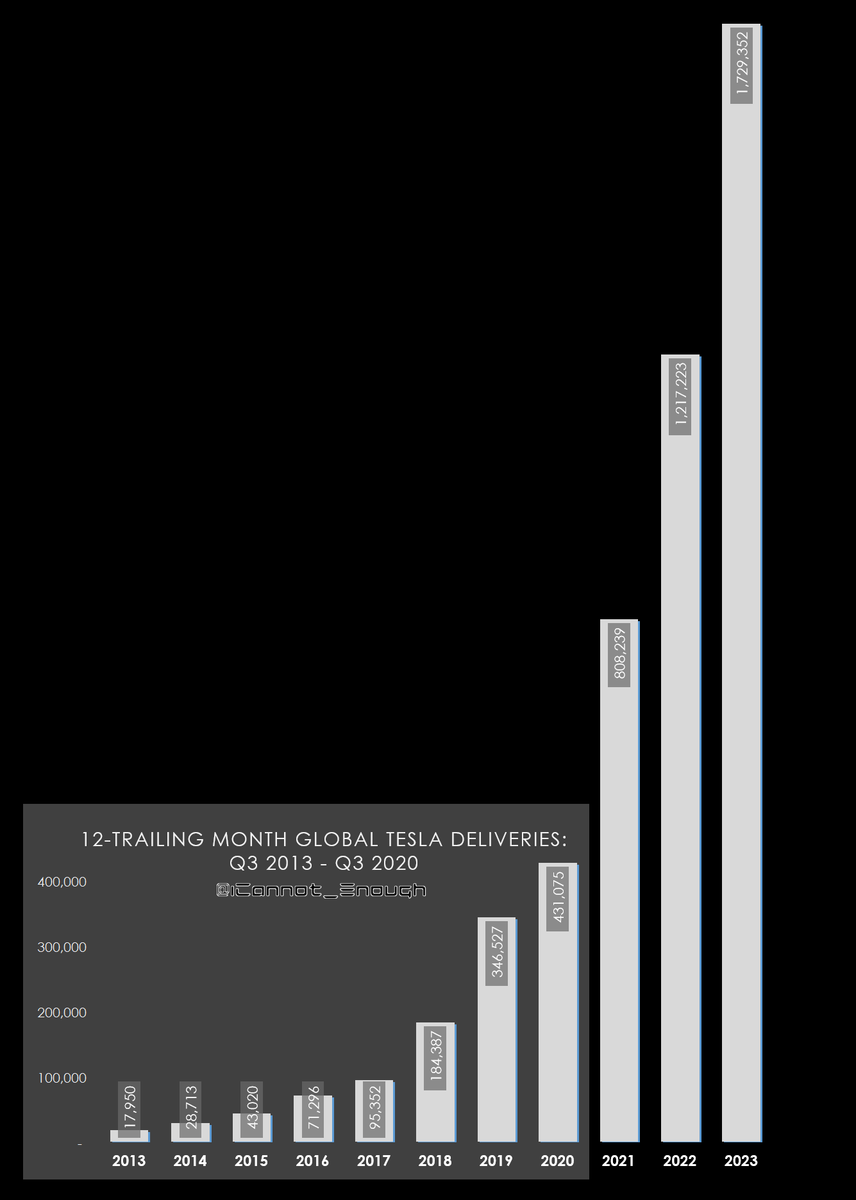
But what if you had printed out that 2020 chart on a piece of paper 3 years ago and decided to update it today?
How could you update your hard copy- with its unshrinkable scale- for the 3 most recent years of data? 🤔
Could you just lay another blank piece of paper next to it and draw the new bars in? No, Tesla has grown too much. They would be literally off-the-chart.
Well, what if you stood that piece of paper up vertically (instead of landscape)? Would they fit then? No.
So... how many pieces of paper would we have to tape together for the 3 most recent bars to fit? 🤓
Are you ready to see the chart above updated? You are not ready. 🚀