$BTC still looks relatively in a pullback. Structure hasn’t been invalidated yet and with the Strait of Hormuz situation, Friday’s gains might get retraced.
Unless ETF demand steps in, but flows won’t be active over the weekend.
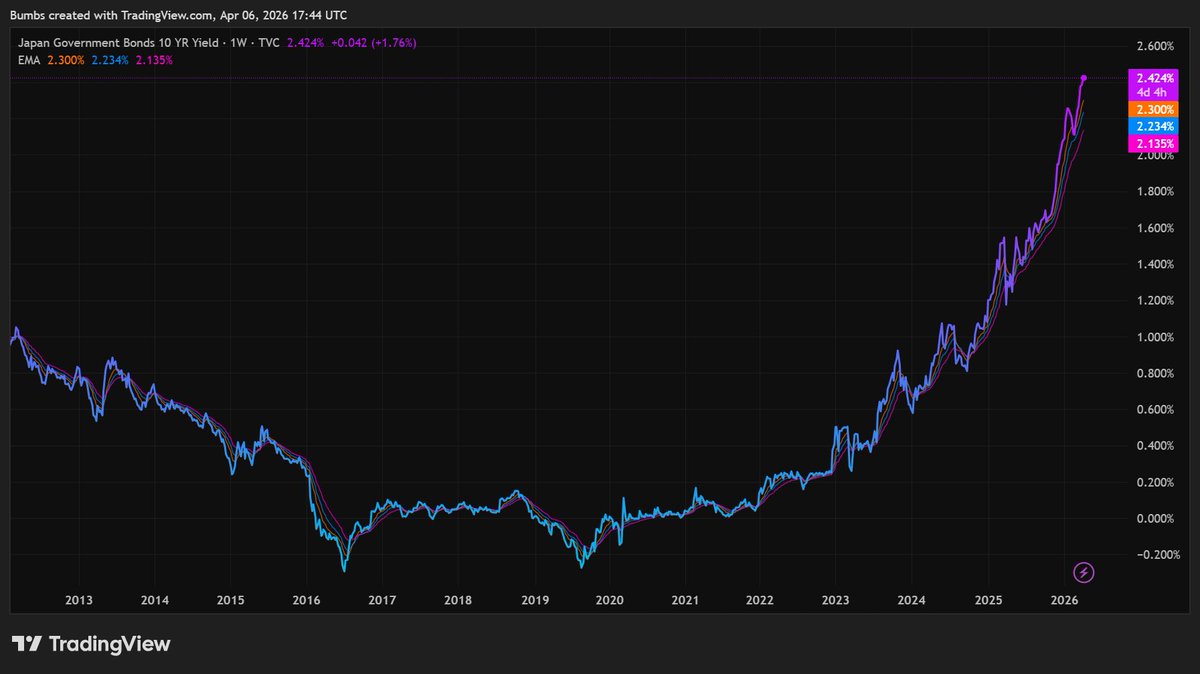
High yields.
Low volume.
3 Billions in shorts liquidated.
And somehow we’re supposed to believe this is the start of a sustainable rally?
I’m not convinced. Bull trap until proven otherwise.
But hey, price is price. So enjoy the pump while it’s here 😮💨
You can't make this up:
At 8:15 AM ET yesterday, the 10Y Note Yield was trading at 4.68% when the US Treasury announced it would be increasing bond buybacks to $4 billion.
The yield fell to a low of 4.63% as the US Treasury pledged to provide "liquidity support."
Exactly 24 hours later, the 10Y Note Yield is ABOVE levels seen prior to the announcement, at 4.71%.
It's going to take a lot more intervention to tame this beast.
Want to know when the next $BTC bottom could be? Look at this.
The last two BULL cycles lasted around 1,071–1,078 days, while the following BEAR cycles lasted almost exactly 357 days.
If $BTC follows the same cycle again, we already have a rough timeframe for the next major bottom.
History doesn’t repeat, but it often rhymes.
Interesting bullish divergence forming on both RSI and Bollinger Band for #IHSG
Price structure still looks weak overall, but momentum indicators are no longer confirming the downside with weaker lows, which suggests selling pressure may be starting to slow down.
Moreover, if you look closely, IHSG has tested the 6900 area multiple times and still hasn’t broken lower.
That makes it a pretty important support zone for now.
As long as price continues to hold above that area, the structure is still manageable and the possibility for stabilization remains there.
Not calling for a full reversal yet, but definitely an interesting area to watch closely.
#BTC Daily still looks fine, price is holding above the short-term EMAs (20, 50 & 100), so support is still being respected for now.
But with the new daily candle, there’s a chance we see continuation lower to sweep the internal lows.
If that happens, 74k area looks like a logical target, I mean especially since it lines up with a key daily S&R.
Overall, downside risk is still there.
Could be slow sideways (time-based capitulation)
or a sharper flush.
Everyone’s talking about #Magnificent7
but almost no one is talking about what you’re actually paying for it.
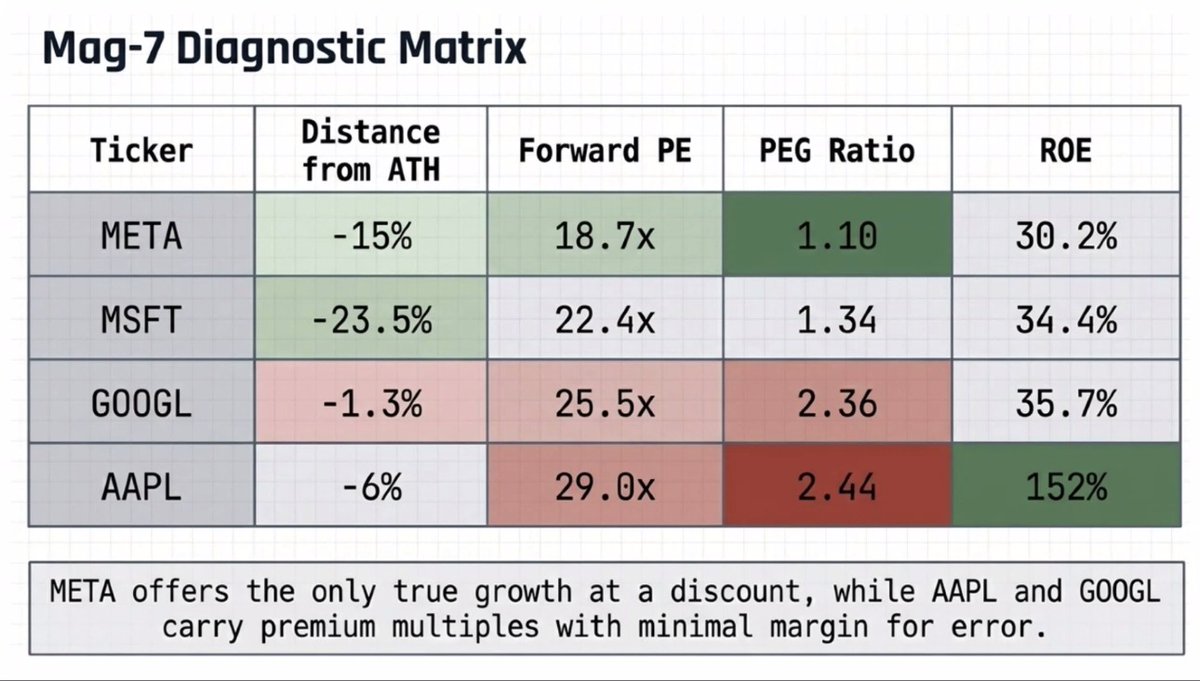
This chart says everything :
Some of these are way more expensive than they look
So i'll break this down simply for you👇
1. META
- META is 15% below ATH
- PE: 18.7x
- PEG: 1.1
You’re getting:
- strong growth
- high profitability (30%+ ROE)
AND a reasonable price
This is what “cheap growth” looks like.
2. MSFT (the safe bet)
MSFT sits right in the middle.
Not cheap, not expensive, just consistent.
- stability
- AI leadership
- predictable earnings
- No crazy upside, but also no major downside narrative.
This is where big money hides.
3. GOOGL (starting to stretch)
GOOGL looks strong fundamentally…
But PEG 2.36 tells a different story.
You’re now paying a lot for that growth.
Which means :
If growth slows even a bit -> valuation gets hit. This is where risk quietly build
4. AAPL
This is the interesting one.
- PE 29x
- PEG 2.44
That’s expensive.
Yes, ROE is insane (150%+),
but that’s boosted by buybacks and not by pure growth.
I don't think people aren’t buying Apple for growth anymore. They’re buying it because it feels safe and that safety comes at a premium.
Well.. so yeah, now you know which ones you’re buying for upside and which ones you’re just buying for safety
#BTC MVRV currently around 1.4
Still far from historical top zones.
MVRV measures how far price is from the average holder's cost basis.
Historically, tops happen above 2.5, while bottoms form near 1
At current levels, the market is more in a recovery phase rather than euphoria, which suggests there's still room for upside if momentum continues
#BTC Liquidation Map.
Don’t get fooled by the chart, different scales. Around 700M longs below versus 8B shorts above.
Liquidity is clearly stacked on the upside, watch for a potential short squeeze.
The US isn’t trying to stabilize the Middle East, it is leveraging instability to push global dependence on US energy and the dollar. In the end, China and EU has no choice but to rely more on US supply.
As I’ve said before, short-term gain but long-term consequences for US
A few things I’m watching ahead : Powell’s term, potential Fed transition and the World Cup.
Jerome Powell’s term as Fed Chair ends in May 2026.
Any transition here matters a lot because the Fed basically drives interest rates -> which impacts liquidity and risk assets like stocks and crypto.
Fed leadership changes usually bring uncertainty.
Markets don’t like that.
One name often mentioned is Kevin Warsh.
Even if he were chosen by Donald Trump, it doesn’t automatically mean RATE CUTS.
Warsh is generally seen as hawkish -> more comfortable with higher rates and focused on inflation.
So there’s a question:
will policy stay tight?
or shift depending on political pressure?
That uncertainty alone can affect market sentiment.
At the same time, the 2026 World Cup (June – July) is coming up.
Historically, markets tend to get quieter during this period.
Lower participation -> thinner liquidity.
And thin liquidity = higher volatility.
Small moves can get amplified.
In conclusion, even though sentiment looks good now, there are still some factors ahead that could make markets more unpredictable.