the AI bubble is inflating in real time, chasing overhyped highs will get your portfolio killed people are buying narratives, not fundamentals and this will eventually get repriced heavily
Yours,
C4pt1v
Everyone is searching for happiness, respectfully, fuck happiness. It will cost you every priceless, long-lasting, God-given gifts. Happiness will always just be a temporary distraction you’ll get nothing lasting out of it. Seek purpose, seek peace. captivate the real energy within you
The market is a pendulum that forever swings between unsustainable optimism (wich makes shares too expensive) and unjustified pessimism (wich makes them too cheap). The intelligent investor is a realist who sells to optimists and buys from pessimists
Yours c4pt1v
Grab popcorn this is where positioning starts.
What you’re looking at is the TOTAL R market cap (ex top 10) vs BTC on the monthly timeframe… and we’re sitting at a 4-year compression breakout zone.
This isn’t noise. This is structure.
For years, capital has been concentrated into majors while alts built a massive base. Now price is reclaiming key levels after a long downtrend, holding above macro support, and pushing into the first resistance cluster (R1).
From an institutional perspective, this is the phase where smart money rotates early before retail even realizes the shift.
Key observations:
•Multi-year descending structure is being broken
•Higher lows forming on HTF = accumulation, not distribution
•Compression + expansion setup → volatility expansion incoming
•Reclaim of moving averages → trend transition in progress
If R1 flips → path to R2 opens fast
If R2 breaks → we’re talking full altseason expansion cycle
The projected move isn’t random it’s based on prior cycle symmetry and liquidity rotation patterns. Once BTC dominance stalls, capital looks for asymmetry… and that’s exactly where alts come in.
This is not the top.
This is the early rotation phase.
Position accordingly.
Yours c4pt1v
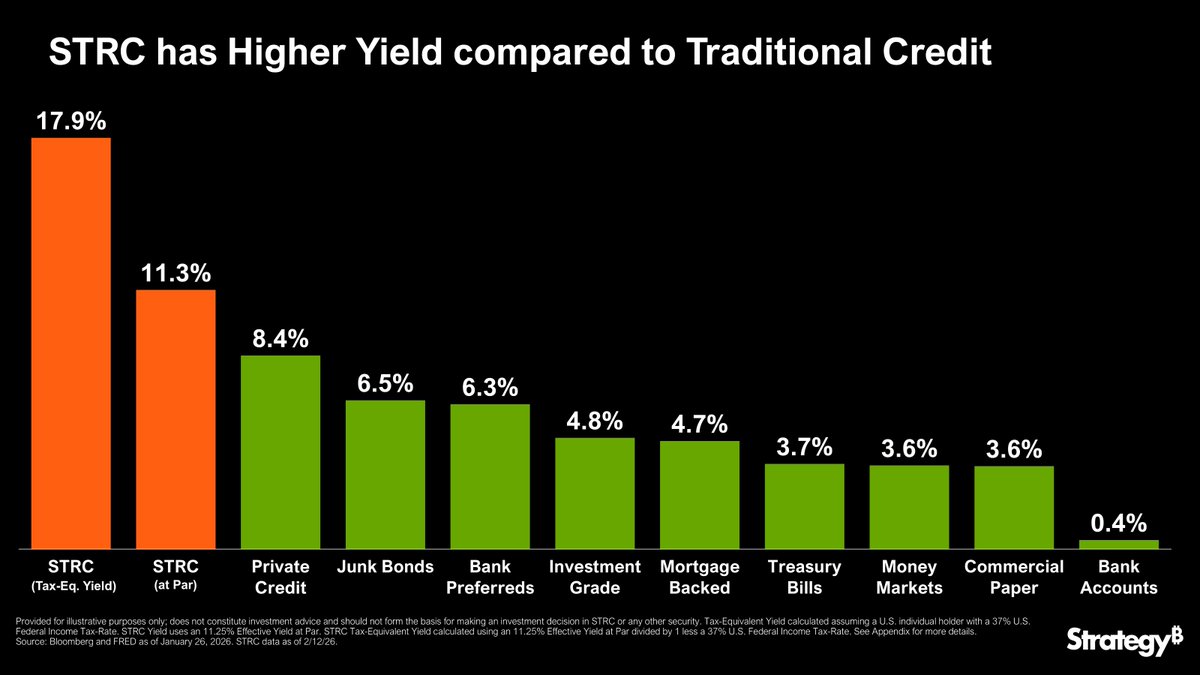
A Simple Theory of Digital Credit:
1. Acquire a large pool of appreciating capital ($BTC).
2. Issue credit ($STRC) against that capital, overcollateralized by the equity base.
3. Monetize a portion of the appreciation—directly or via derivatives ($MSTR)—to fund the dividend.
The 20 millionth Bitcoin was mined yesterday. Now there are only one million new Bitcoins to be mined, which will take over 100 years.
Decentralized, inflation-proof, global money.
Strategy has acquired 17,994 BTC for ~$1.28 billion at ~$70,946 per bitcoin. As of 3/8/2026, we hodl 738,731 $BTC acquired for ~$56.04 billion at ~$75,862 per bitcoin. $MSTR $STRC https://t.co/wB1k3Nt1xa
The Romans called it “bread and circuses.”
Feed the people, entertain them with spectacle, and they won’t question power even while the empire quietly declines.
Let that sink in.
Yours,
C4pt1v
The future belongs to freedom It belongs to no single country, institution, or government It belongs to a decentralized digital world
And yet people still believe Bitcoin or the entire crypto sector has already reached its final mc.
Just look at the scale of other global asset classes
Gold alone estimated to have a market capitalization of $35 trillion (1st)
Meanwhile, the global stock market exceeds $100 trillion in total value
And the entire cryptocurrency market is only $2,4 trillion dollars in value (13th)
In other words, crypto is still just a tiny fraction of global wealth
So when people claim the market is already “too big” or that the upside is limited, they are ignoring the bigger picture
That’s why I don’t pay much attention to short-term speculation and noise
I’m invested in crypto because I genuinely believe the technology has more long-term potential than most people realize
We are still early
Infrastructure is still being built Regulation is still evolving And mainstream adoption has only just begun
The digital financial system of the future will not appear overnight but the foundations are already being laid today
Yours,
C4pt1v
Across the broader crypto market, most altcoins are currently forming falling wedge patterns a structure that has historically acted as a bullish reversal signal
What makes this particularly compelling is the scale. When one or two assets print a falling wedge, it can be dismissed as noise. But when the majority of the altcoin market compresses into the same tightening, downward structure, it reflects something deeper, sellers are losing momentum, volatility is contracting and supply is getting absorbed
A falling wedge represents controlled capitulation lower highs and lower lows, but with weakening downside pressure
Eventually, price reaches a point where there’s simply not enough selling left to sustain the trend. That’s when breakouts tend to occur often fast and aggressively.
The longer the compression, the more violent the expansion typically is. And right now, many alts are coiling simultaneously
Markets move from contraction to expansion.
This is contraction.
It’s not about if momentum returns it’s about when
Position yourself accordingly. I’ll continue to DCA conviction only
Yours,
c4pt1v
Bitcoin (1M) Analysis
Major Resistance: 80k (horizontal pivot), 90k+, 110–120k high
Critical Support (current battle): 60k -69k
Projected Wave (4) Bottom: 50–58k (Q2 2026)
EMA 13 / 48
•Price below EMA 13 medium-term bearish momentum
•EMA 48 68k current decision zone
Gaussian Channel (144):
•Price reverting toward mid/lower band
•50–58k aligns with structural channel support
In prior cycles:
•2019 bottom band touch
•2020 bottom band touch
•2022 bottom band deviation & reclaim
Bitcoin bottoms when:
Price reaches structural channel compression + volatility contraction.
RSI 14
•Previously overheated (~75)
•Now compressing toward historical bottom zone (37–43 region)
•A bullish divergence here would confirm cycle low formation
Elliott Structure
Previous cycle completed 5-wave advance.
Current move appears corrective.
projected path:
(4) bottom in 50–58k
(5) back toward 80–100k.
What’s Different This Cycle
This cycle is structurally different Bitcoin is no longer purely retail-driven.
First of all Institutional Capital + ETFs
Spot ETFs changed market mechanics:
•Large passive inflows
•Faster liquidity absorption
•Immediate distribution when flows reverse
•Reflexive volatility (flows amplify moves both directions)
Markets now move faster because capital moves faster as simple as that no reason to hate on the volatility take god‘s gift.
Drawdowns compress in time though.
Historical Context Panic at 60k
I’m going to keep it very brief and simple here 60k was the previous ATH in 2021.
Now we’re seeing panic and “it‘s over” with an index hitting ATL (5), this psychology at 60–66k, a level that used to be euphoric all-time highs.
That is structural uptrend behavior.
Panic is occurring at former ATHs.
That signals trend continuation, not macro breakdown…
Structural Market Memory (Former ATH Flip Logic)
60k was the 2021 euphoric ATH.
In strong secular trends:
• Old ATHs become long-term support
• Price often slightly undershoots before reclaim
A move to 50–58k would
• Sweep below psychological 60k
• Trigger final capitulation
• Trap late shorts on reclaim
Bitcoin historically
• Wicks below obvious support
• Reverses from liquidity pockets
50–58k is where
• Liquidity gets harvested
• Panic climaxes
• The structural uptrend remains intact
That’s how macro continuation structures form.
Speed of This Correction
Previous cycles:
•Long grinding multi-year drawdowns
•Slow miner capitulation phases
Now:
•Faster repricing
•Faster liquidity events
•Faster sentiment resets
This looks like a speedrun correction, not structural collapse.
Bitcoin maturity + institutionalization compresses time!
Why 50–58k Beyond TA
Talking here about Mining Economics
Bitcoin network consumption ~138 TWh/year.
•At $0.05/kWh ~42k electrical cost per BTC
•At $0.06–0.07/kWh ~50–58k production cost range
Since CBECI models exclude non-electrical costs (hardware, infra, financing), real break-even is higher than pure electricity.
That makes 50–58k a realistic industrial equilibrium zone.
Network Maturity
•Hashrate ~1 ZH/s
•Difficulty near cycle highs
•Block reward post-halving: 3.125 BTC
•Fees remain low % of miner revenue means pressure during downturns
If price drops into 50–58k:
weaker miners capitulate
difficulty adjusts
production equilibrium resets
historically aligns with macro bottoms
C4pt1v conclusion
This isn’t a weak network it’s a maturing industrial asset repricing toward production equilibrium inside a long-term uptrend.
Scenarios:
•Hold 60–69k recovery toward 80k
•Drop to 50–58k likely cycle low Q2 2026
50–58k bottom aligns with:
•Monthly structural support
•Mining cost equilibrium
•Post-halving pressure dynamics
•projected Gaussian structure
•RSI macro reset zone
•Psychological liquidity sweep
•Elliott proportional retracement
•Former ATH deviation
•Post-halving miner stress window
•ETF-driven volatility compression