Two Anthropic engineers, who built Claude just explained why you use less than 10% of actual Claude abilities.
This 24-minute talk will change how you use Claude Code forever.
Watch it, then read the breakdown below👇
🚨Breaking: The guy who created Claude Code (@bcherny) just revealed how his team actually trains their AI.
One file: CLAUDE.md
You place it at the root of your project.
Inside it:
past mistakes
conventions
rules
Claude reads it every session.
The result?
The agent improves over time without you touching the code.
Every bug that gets fixed becomes a permanent rule.
Boris Cherny uses this internally at Anthropic every day.
Here’s the template he shared — ready to copy, paste, and adapt.
CLAUDE.md Template
1. Plan Mode Default
Enter plan mode for any non-trivial task (3+ steps or architectural decisions)
If something goes wrong, STOP and re-plan immediately — don’t keep pushing
Use plan mode for verification steps, not just building
Write detailed specs upfront to reduce ambiguity
2. Subagent Strategy
Use subagents frequently to keep the main context window clean
Offload research, exploration, and parallel analysis to subagents
For complex problems, throw more compute via subagents
Assign one task per subagent for focused execution
3. Self-Improvement Loop
After any correction from the user, update tasks/lessons.md with the pattern
Write rules for yourself to prevent repeating the same mistake
Ruthlessly iterate on these lessons until the mistake rate drops
Review lessons at the start of each session
4. Verification Before Done
Never mark a task complete without proving it works
Diff behavior between main and your changes when relevant
Ask yourself: “Would a staff engineer approve this?”
Run tests, check logs, and demonstrate correctness
5. Demand Elegance (Balanced)
For non-trivial changes, ask: “Is there a more elegant solution?”
If a fix feels hacky, ask:
“Knowing everything I know now, implement the elegant solution.”
Skip this for simple fixes — don’t over-engineer
Challenge your own work before presenting it
6. Autonomous Bug Fixing
When given a bug report: just fix it
Use logs, errors, and failing tests to diagnose
Require zero context switching from the user
Fix failing CI tests automatically
Task Management
1. Plan First – Write the plan in tasks/todo.md with checkable items
2. Verify Plan – Confirm the plan before implementation
3. Track Progress – Mark items complete as you go
4. Explain Changes – Provide a high-level summary at each step
5. Document Results – Add a review section to tasks/todo.md
6. Capture Lessons – Update tasks/lessons.md after corrections
Core Principles
Simplicity First
Make every change as simple as possible and minimize code impact.
No Laziness
Find root causes. Avoid temporary fixes. Maintain senior-level engineering standards.
Paste the following into Claude Code: https://t.co/NgNqgELZE9
If you want more practical AI gems and use cases, join our free newsletter with daily tutorials and latest news in AI: https://t.co/pFJ6vK3kcc
How to set up the Claude completely in just 1 day:
(Save this. Send it to your team. Thank me later.)
Tool 1: Cowork
Download Claude (claude .com/download).
Open the Cowork tab.
Select a folder from your computer.
Now build your brain file. Create "about-me .md."
To download mine, go here: https://t.co/psB7XxAv8w.
Don't pay anything. It's free in the welcome email.
Then, start every chat with this prompt:
"Read the files first. Then ask me questions before doing anything."
Tool 2: Model
Pick Opus 4.6 (it's the best model right now).
Turn on Extended Thinking.
Most skip this & wonder why Claude feels generic.
Then go to Settings > Connectors.
Link Slack, Google Drive, Notion.
Claude now reads your actual workspace.
Tool 3: Excel
Open Excel. Go to Insert > Get Add-ins.
Search "Claude by Anthropic." Install.
Open any spreadsheet. Ask: "Give me a summary of each tab." Claude lives inside the spreadsheet. It knows what D14 actually contains.
Tool 4: Plugins
Go to claude .com/plugins.
Pick the one as per your job.
Marketing. Sales. Legal. Finance. Data.
Click install. Type / in your next chat.
Legal software companies lost $285B in market cap when these dropped. That's a signal.
Tool 5: Artifacts
Nothing to install. Ask Claude to build something.
"Create an interactive HTML calculator for [thing]."
You get a working tool inside the chat. Not text. Not a suggestion. A thing you click and use.
Tool 6: Projects
Go to claude .ai. Click Projects. Create one. Upload your files and add instructions. Every chat inside the project remembers your context.
Honest take: Cowork replaced this for me.
But for teams, it still works.
Where Claude falls short:
No image generation. Use Gemini.
Not the best at real-time search. Use Grok.
Not the best at everything. No tool is.
But for writing, thinking, analyzing, and working with your files? It's the best.
The real difference:
Most people open Claude, type one prompt, get a mid response, and leave.
Because they set up one tool out of six.
Set up all six. It takes 1 day.
Then you'll understand why everyone switched.
Full setup guide + features: https://t.co/jw2qdIbLxJ
Full Claude cowork set up: https://t.co/uWTpOI3oyE
Follow for more @rubenhassid
🚨 BREAKING:
Claude can now explain any complex topic like a university professor (for free).
10 Claude prompts that help you to learn anything 10× faster:
(bookmark it)
In 2023, Stanford professor Matt Abrahams gave a masterclass on how to think fast & speak smartly on the spot.
He explained:
• Why anxiety destroys clarity
• How structure beats intelligence
• Secret to spontaneous charisma
12 lessons to master communication in real time:
I've written 500 articles, 23 whitepapers, and 3 ebooks using Claude over 2 years.
These 10 prompts are the ONLY ones I actually use anymore because they handle 90% of professional writing better than any human editor I've worked with and cost me $0.02 per 1000 words: 👇
The gtsummary package in R makes it easy to create clean, publication-ready summary tables for your data. The tbl_summary() function takes a data set and generates well-organized tables that display key statistics like counts, percentages, means, and medians, which is perfect for presenting descriptive statistics in reports, manuscripts, or presentations.
✔️ Streamlines Descriptive Statistics: Quickly generates clear and professional summary tables.
✔️ Customizable: Offers flexible options for labels, decimal places, and formatting.
✔️ Supports Various Data Types: Works with continuous, categorical, and dichotomous variables seamlessly.
The visualization below shows a sample table created with tbl_summary(), illustrating its ability to organize and present descriptive statistics effectively. Visualization adapted from the official package website: https://t.co/eGJjBEUVeT
Want to explore more practical tips on Statistics, Data Science, R, and Python? Subscribe to my email newsletter! For more information, visit this link: https://t.co/ktUcWo9XpO
#Statistical #RStats #Data #Rpackage
An excellent video tutorial by Dr. Whitney Holden on how to use PubMed.
She covers:
• How to run searches in PubMed
• How to limit your search
• How to find review articles
• How to get citations
• How to download free full texts of articles
• How to create alerts using PubMed or PubCrawler
Follow Silvi on LinkedIn for more tips and free resources on systematic reviews and academic writing.
https://t.co/xq0liSELMR
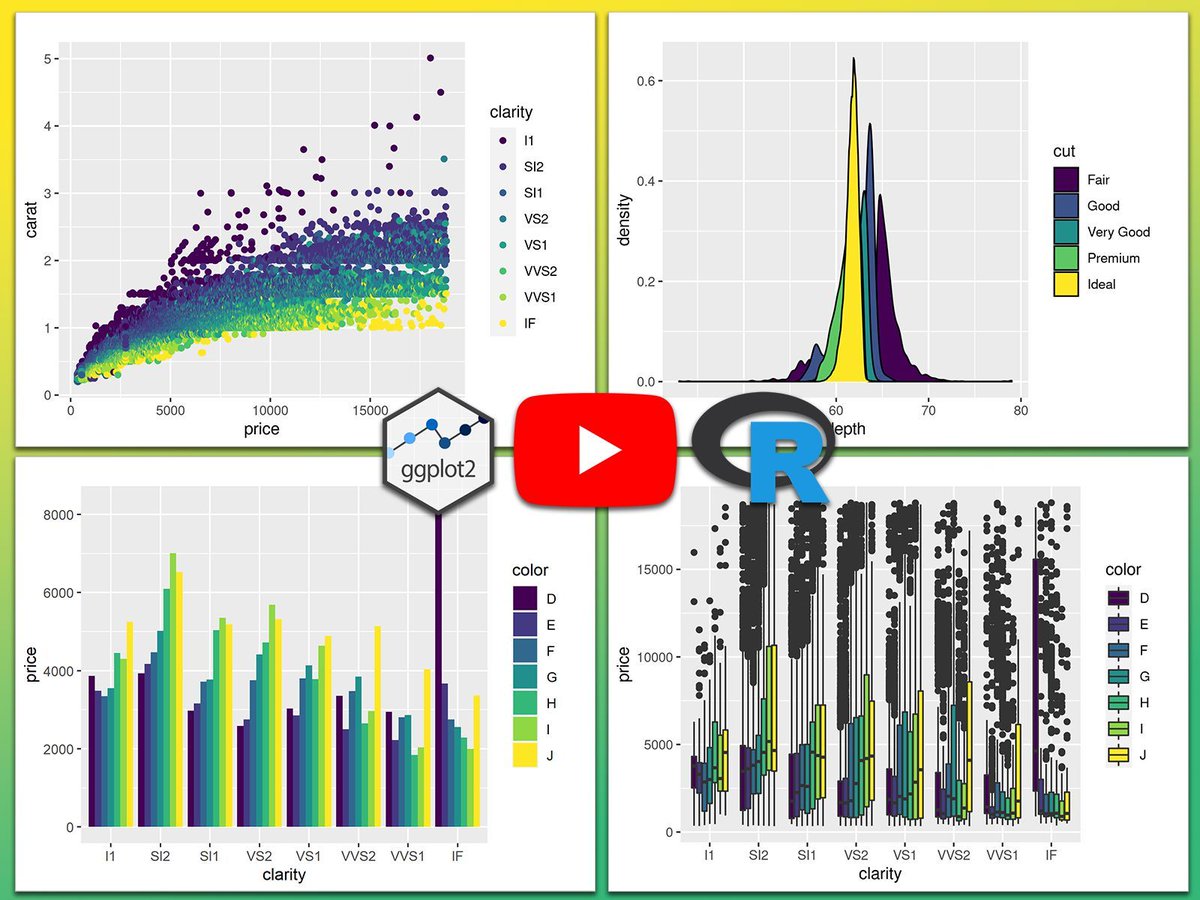
In my opinion, ggplot2 is by far the best tool for visualizing your data! Built on the Grammar of Graphics, it offers a structured, powerful approach for creating insightful and visually compelling plots that elevate data storytelling. Whether you’re working with simple visuals or complex, multi-layered charts, ggplot2 provides the flexibility and control needed at any skill level.
Here’s why ggplot2 stands out:
✔️ Structured Approach: ggplot2 organizes visuals through layers, making it easy to add elements like titles, labels, colors, and themes. This layered design simplifies the process of building, customizing, and refining your plots.
✔️ Complete Customization: Control every aspect of your plot—from scales and fonts to colors and legends—allowing you to tailor visuals precisely to your data insights.
✔️ Broad Applications: From bar charts and line plots to scatter plots and maps, ggplot2 supports a wide range of visualization types, making it adaptable to any data set.
✔️ Scalable for All Data Sizes: Effortlessly handle data of any size, from small samples to large-scale data, while maintaining high performance.
I’ve created a tutorial that dives deep into ggplot2:
Video: https://t.co/69VKKRx6rj
Website Tutorial: https://t.co/1nu7QBPfdk
If you’re interested in exploring ggplot2 and advanced visualization techniques in R further, consider joining my course, "Data Visualization in R Using ggplot2 & Friends!"
See this link for additional information: https://t.co/ztlEzoEDWv
#coding #ggplot2 #DataVisualization #tidyverse


![rubenhassid's tweet photo. How to set up the Claude completely in just 1 day:
(Save this. Send it to your team. Thank me later.)
Tool 1: Cowork
Download Claude (claude .com/download).
Open the Cowork tab.
Select a folder from your computer.
Now build your brain file. Create "about-me .md."
To download mine, go here: https://t.co/psB7XxAv8w.
Don't pay anything. It's free in the welcome email.
Then, start every chat with this prompt:
"Read the files first. Then ask me questions before doing anything."
Tool 2: Model
Pick Opus 4.6 (it's the best model right now).
Turn on Extended Thinking.
Most skip this & wonder why Claude feels generic.
Then go to Settings > Connectors.
Link Slack, Google Drive, Notion.
Claude now reads your actual workspace.
Tool 3: Excel
Open Excel. Go to Insert > Get Add-ins.
Search "Claude by Anthropic." Install.
Open any spreadsheet. Ask: "Give me a summary of each tab." Claude lives inside the spreadsheet. It knows what D14 actually contains.
Tool 4: Plugins
Go to claude .com/plugins.
Pick the one as per your job.
Marketing. Sales. Legal. Finance. Data.
Click install. Type / in your next chat.
Legal software companies lost $285B in market cap when these dropped. That's a signal.
Tool 5: Artifacts
Nothing to install. Ask Claude to build something.
"Create an interactive HTML calculator for [thing]."
You get a working tool inside the chat. Not text. Not a suggestion. A thing you click and use.
Tool 6: Projects
Go to claude .ai. Click Projects. Create one. Upload your files and add instructions. Every chat inside the project remembers your context.
Honest take: Cowork replaced this for me.
But for teams, it still works.
Where Claude falls short:
No image generation. Use Gemini.
Not the best at real-time search. Use Grok.
Not the best at everything. No tool is.
But for writing, thinking, analyzing, and working with your files? It's the best.
The real difference:
Most people open Claude, type one prompt, get a mid response, and leave.
Because they set up one tool out of six.
Set up all six. It takes 1 day.
Then you'll understand why everyone switched.
Full setup guide + features: https://t.co/jw2qdIbLxJ
Full Claude cowork set up: https://t.co/uWTpOI3oyE
Follow for more @rubenhassid](https://pbs.twimg.com/media/HDHuZ3iWUAEvEMY.jpg)


![ahuja_priyank's tweet photo. Learn faster with AI using Google NotebookLM.
Use this cheat sheet to get the most out of it and accelerate your learning.
[Mandatory Bookmark] https://t.co/XjWKB9GIRK](https://pbs.twimg.com/media/HBH4JwfagAE5-5L.png)