📈Copper is ripping - and this could be good news for bitcoin
It seems like everything is down for the year.
But one thing that is not down in 2025 is commodities in general - and copper in particular.
Copper has been absolutely ripping higher since the start of the year.
It must be among the best performing assets in the world in 2025 so far (+9%).
I'm not particularly interested in trading copper - but I am very interested in what it might mean for the business cycle and risk assets.
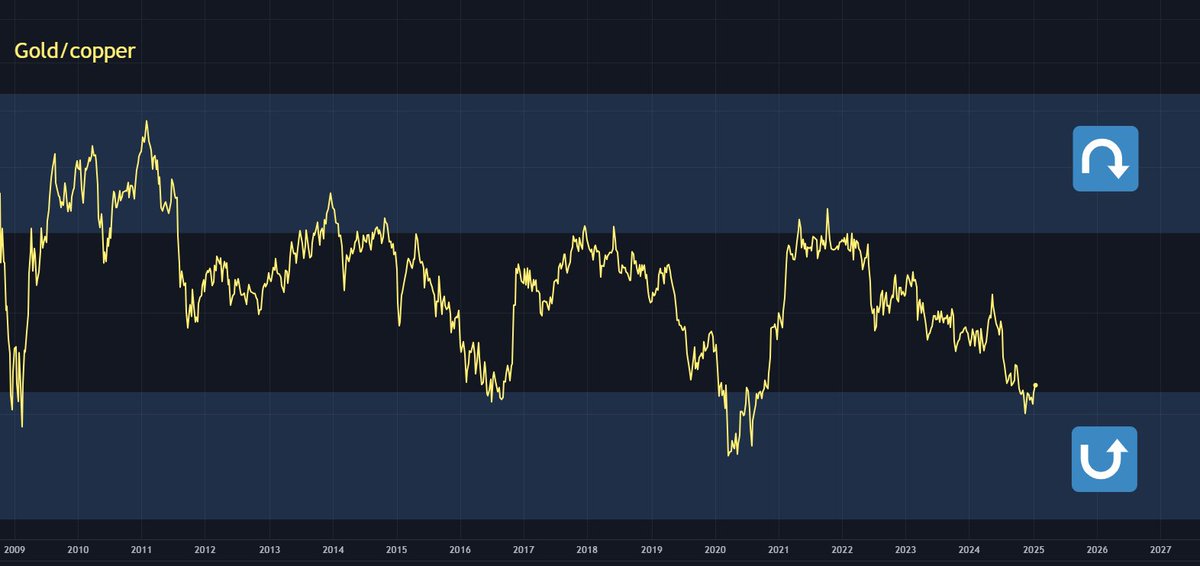
Specifically, the copper/gold ratio - which saw its most recent low on November 22 2024, and has been rising ever since.
The copper/gold ratio has historically moved in cycles, with cyclical periods of gold outperformance (down phases) and copper outperformance (up phases).
Is a new copper/gold up phase beginning?
Here's some facts about the copper/gold ratio:
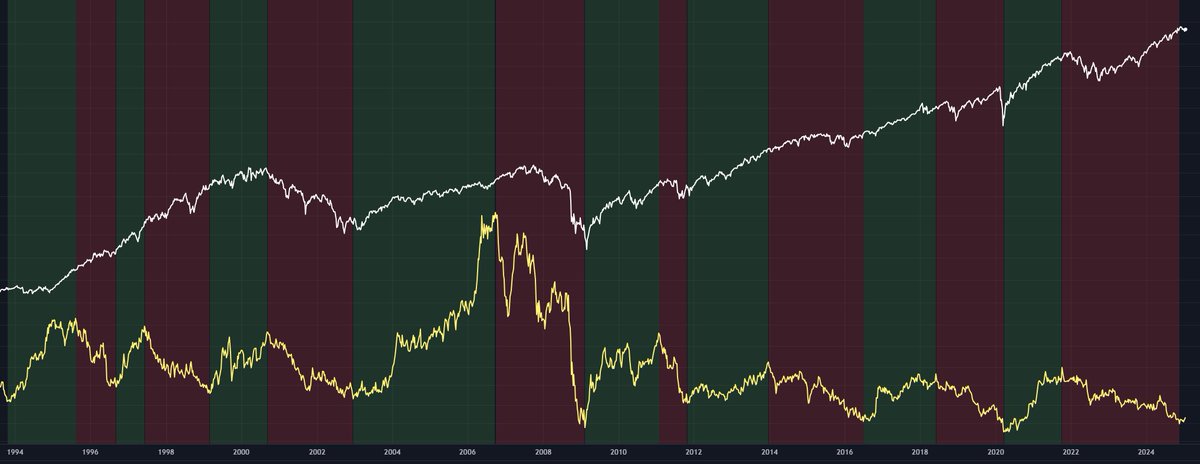
Since the mid-1990s
The S&P 500 has not had a correction of more than 20% during a copper/gold cyclical up phase (🟢).
Every "large" correction in the S&P 500 (20%+) occurred during a copper/gold cyclical down phase (🔴).
The S&P 500 has had a positive performance during every up phase (8 in total - the lowest being 18% in 1999/2000).
It's a similar picture with bitcoin.
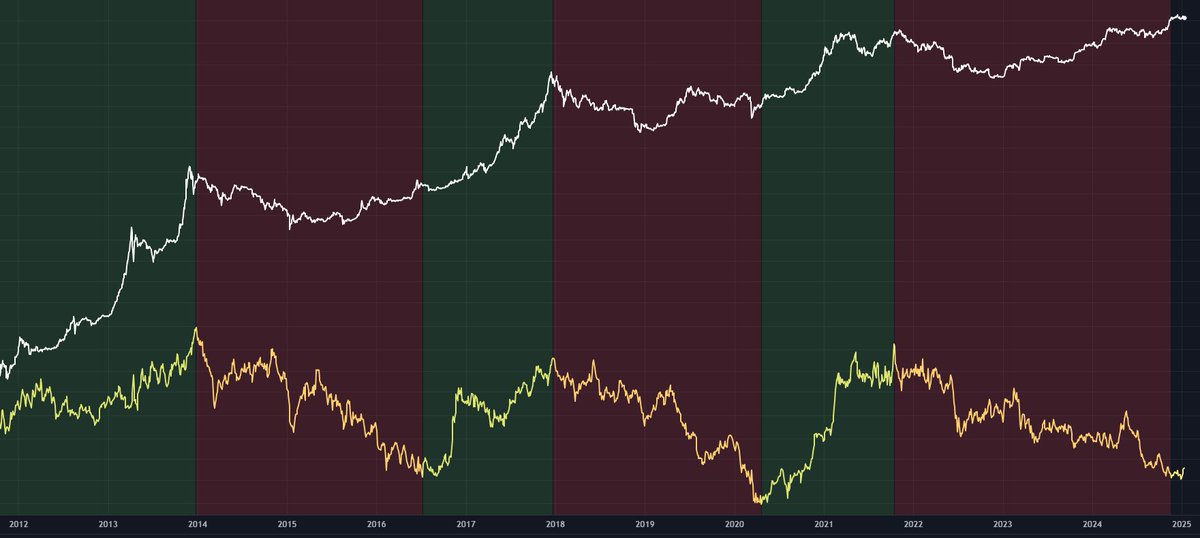
Since 2011
Every bitcoin "mania surge" has occurred during an up phase (🟢).
In fact, an up phase has not occurred without a bitcoin "mania surge".
Every bitcoin bear market has occurred during a down phase (🔴).
In fact, a down phase has not occurred without a bitcoin bear market.
The end of every bitcoin "mania surge" has coincided with the end of an up phase, within a matter of days.
So what actually is the copper/gold ratio?
For decades, the copper/gold ratio has essentially been a real-time, mark-to-market measure of the business cycle.
The reason is pretty simple:
Improving business conditions = more industrial demand for copper and less safe haven demand for gold
Deteriorating business conditions = less industrial demand for copper and more safe haven demand for gold
It represents real people, doing real things, in the real economy.
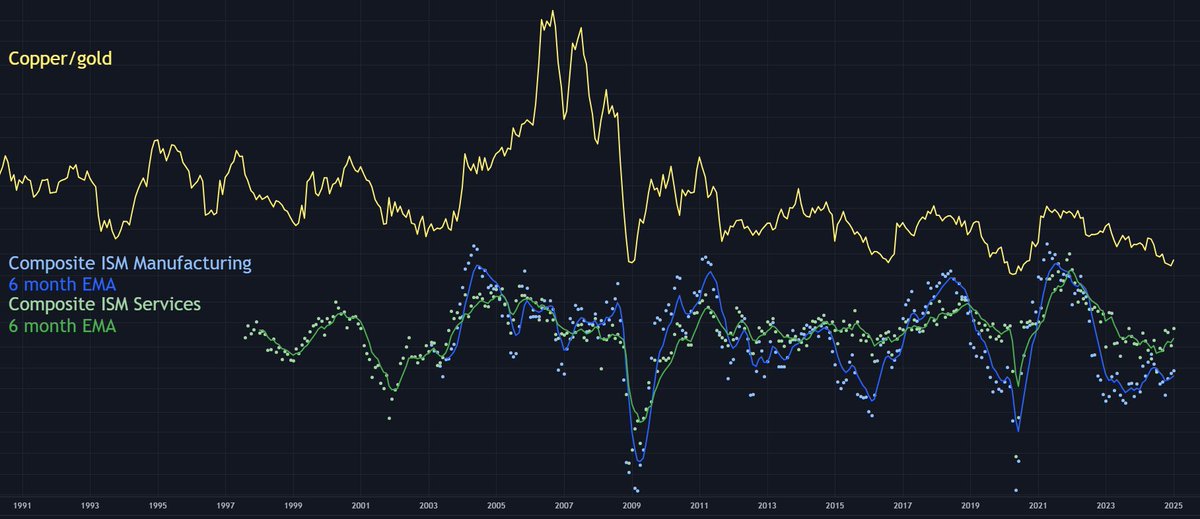
It tracks very well with US ISM measures.
You can see on the chart below that both US services and manufacturing ISM measures have been attempting to move back upwards (business conditions improving), but it doesn't look all that convincing yet, particularly manufacturing.
So, I've been waiting patiently for copper to finally wake up.
Copper/gold could be the big signal that the business cycle is improving.
If a new copper/gold cyclical up phase did indeed start on November 22 2024, you can expect it to last until anywhere from late 2025 to late 2027 (based on the length of previous up phases - the average duration of an up phase since the early 1990s is 658 days).
But is "this time different"?
This time around, risk assets have generally performed very well during this latest copper/gold down phase.
The S&P 500 has already been flying for more than two years, and bitcoin has already arguably started a new "mania surge", breaking well past its previous all-time high.
This makes me question whether something might actually be "different this time".
However, this has happened before - throughout the late 1990s, the S&P 500 stormed higher through two down phases.
There's also the small problem of economic trouble and deflation in China - the manufacturing engine of the world.
This might weigh heavily on the global business cycle, and particularly on copper demand.
Is "this time different"? 🤔