To understand scaling in politics/economics/culture:
Mediterraneans (olive oil pple) have traditionally done best in groups & organizations of size < n,
N. Europeans (Butter pple) do best in groups & organizations > n.
Creating large orgs/states= Procrustean bed.
Discuss.
2015: When people ask me to talk about RISK, I talk about epidemics. Not ISIS, not journalistic BS.
[I lost weight and increased by Max DL by 100 lbs since]
https://t.co/h5fPaiIAsP via @YouTube
Que el mundo lo vea: la policia intenta atropellar manifestantes en BCN. Aquí está la verdadera violencia. El Estado ya está buscando muertos. Las imágenes hablan por si solas.
La meu mare és mestra jubilada i te l'obstinació d'intentar convèncer amb paraules quan algú fa les coses malament. No crec que se'n sortís amb ells, però quin orgull de mare!!
Foto: Carlos Janer
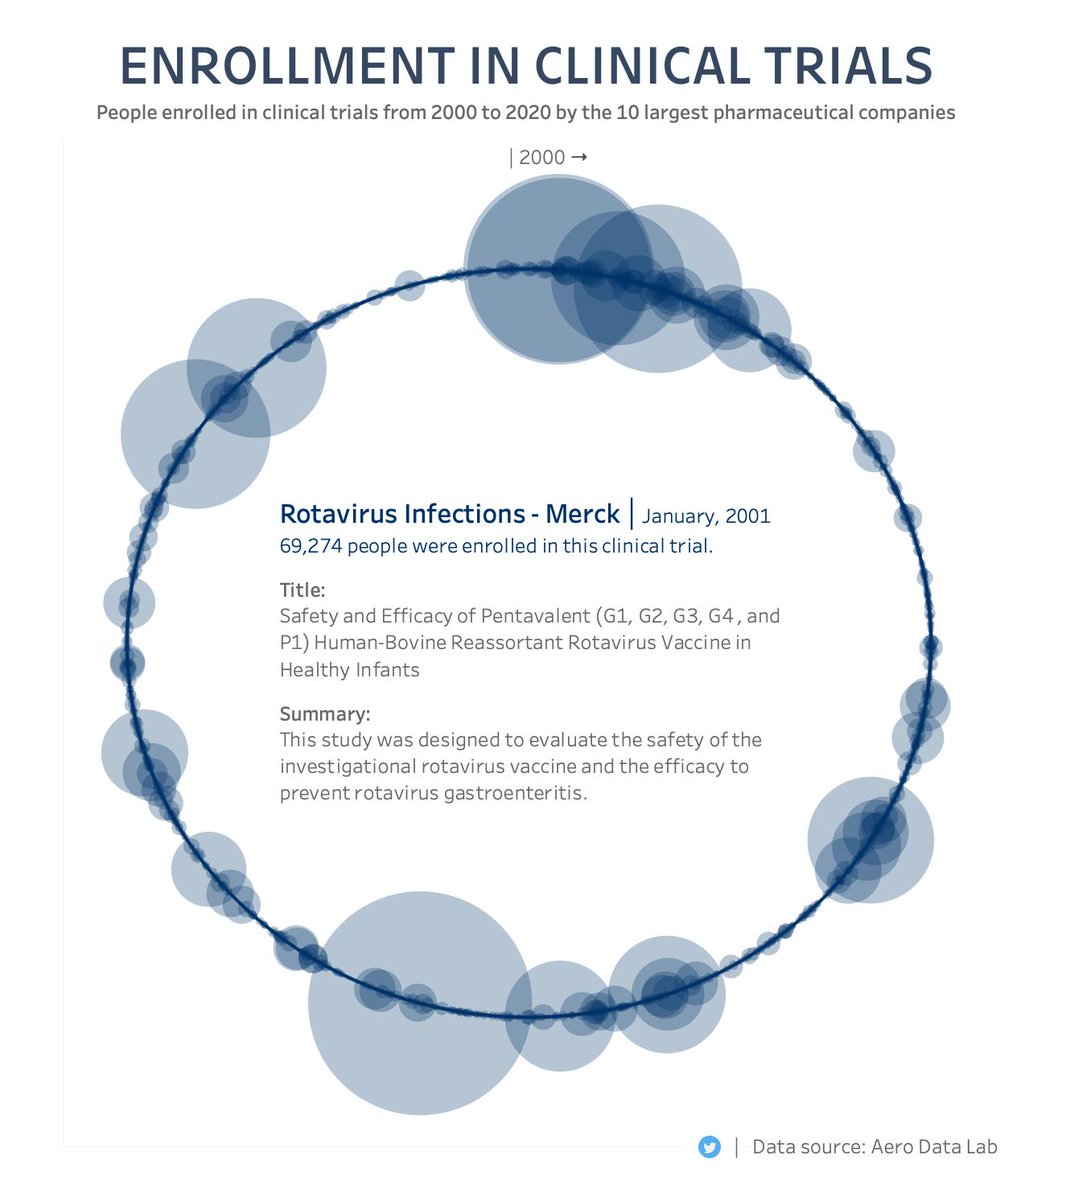
Very interesting dataset from @SpencerPHey to visualize clinical trial data. An analysis of people enrolled in pharma clinical trials in the last 20 years.
Article: https://t.co/zYWg3c2owZ
Link to @tableaupublic: (link: https://t.co/q8D3dRsPPd)
#makeovermonday#tableau
New Project - Tableau Chart Catalog which shows 100 chart types & variations from 74 different authors. Intended as a chart reference guide, all were built in Tableau, published on Tableau Public, & downloadable. Thanks to all the amazing contributors! https://t.co/6rX77jMM2w
@marmstm @TriMyData@VizWizBI@tableaupublic Looks great Matthew! Nice story and including the labels in the chart is a great idea. Thanks for the mention!
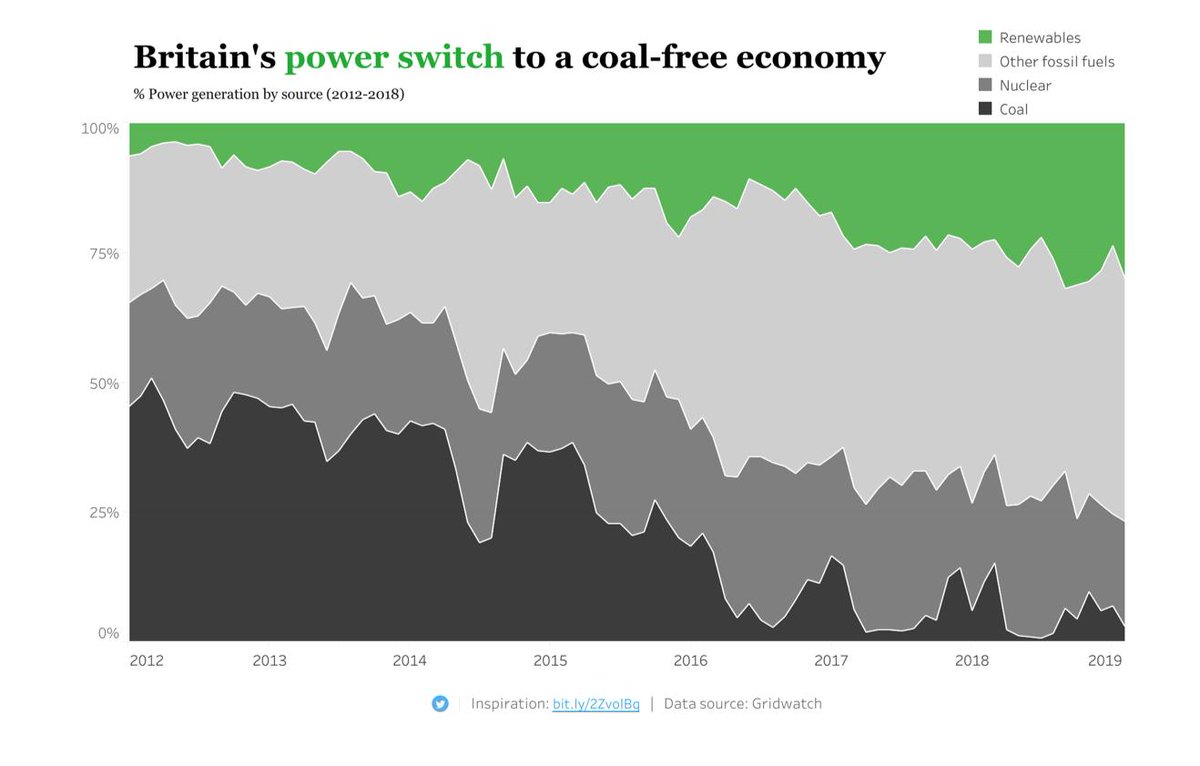
How has Britain become a coal-free economy? | Analyzing the change in the energy sources from a @guardian article.
Article: https://t.co/RgRQYj0qpt
Link to @tableaupublic: https://t.co/cQQaDFtgA8
#makeovermonday#tableau
Making a #dataviz for both desktop and mobile doesn't mean that the only two options you have are "scaling down" and "stacking vertically" →
You can also change layout by positioning the data differently. There's more overlap in code between these two than you might expect.
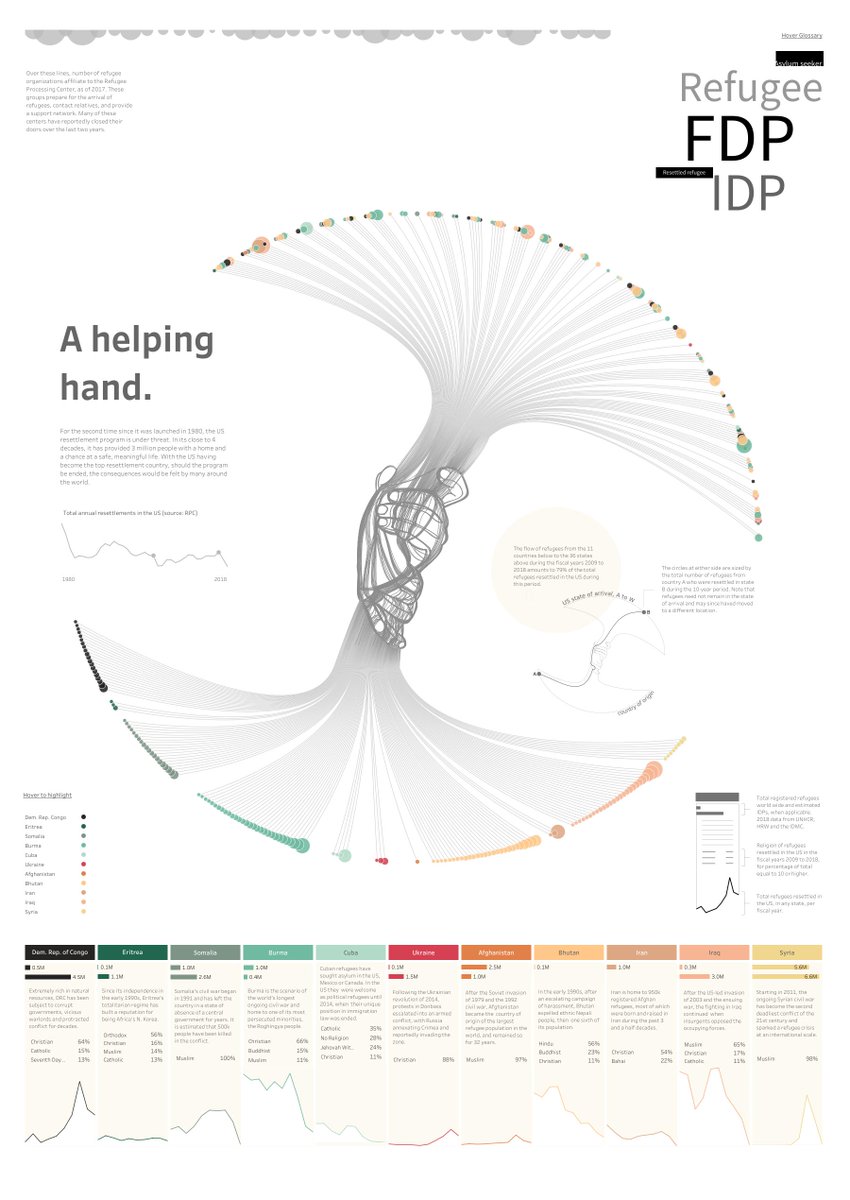
Are you tired of the same old sankey diagrams? Well maybe you want to spice them up and make circular sankeys. Here is a tutorial to get you started!
https://t.co/fG5cpVVKIA
First @tableaupublic Viz in a good while. "Florida Squeeze - sea level rise 🌊 & fate of the endemic Key Deer 🦌". This was a good excuse to get to grips with some neat functions in QGIS. #dataviz
https://t.co/w7bUJWNmRM
Week 4 of #makeovermonday analyzing the electricity consumption at 10 Downing Street. Tried to plot a calendar for this one.
#DataViz#tableau
https://t.co/LYkNIkbVzM