As R voters seems to be coming out in huge numbers Election Day, we point to our nearly one-week old report where we showed Democrats front-loading reliable voters.
Election data we report is official, we haven't used any polling or made predictions yet.
https://t.co/cTf5cDKEoL
We’ll be announce an API for election night, 5-10 minute delayed and rate-limited for free plans, sub 1-minute updates and webhooks for enterprise plans.
Reach out in DMs or [email protected] if would be interested.
We’ve made partnerships for data with 4 political and strategy firms after increased interest this morning.
If you need to understand where voters are coming from or want to drive turnout through accurate, pinpoint geo-sharded data, reach out to us.
https://t.co/4Kz0NsLKZ7
22% of Arizona’s 2026 early voters did not vote in the 2022 general election. Each bar shows a county’s 2022 voting-history mix. Mail + early in-person, estimated through Oct 31. Source: Aristotle.
This is genuinely coming out very late, but I've finally harnessed the multi-headed hydra that is terabytes unclean election data (curses), and today spent time analyzing all of it.
First research report released, an insight no one has apparently yet stumbled upon.
More, and more reports coming out in droves all night! And the final predictive modelling results tomorrow morning. Though many polling has already been released, and D advantage obvious, the early votes have been heavily consistent voters. High-propensity republicans are voting at the same pace as earlier years, but democrats are drawing down their pool faster.
I'm also super happy with this first report, because of how I made the charts represent intentions which is a hint for what Carmena's Overton Research will look like. In this chart bunched together dots indicate less rural/urban polarity, and the more left the more partisan and polarized an election.
P.S: Upset a little with the delay, but incredibly happy this task that was absolutely mind-bogglingly stupid and delusional to even fathom just 6 days ago, I think I've managed to get done just a couple hours late... we have a fully fledged, most wholistic election database on the internet and streams will be set up for it tomorrow too. Obviously, I'm not sleeping with less than 12 hours left to election start. That's a given.
Some help from @getcontextdev and @mynameisyahia patching bugs in literally seconds. Wish I'd used it earlier to do easy 429-bypasses instead of manually building an bypass-framework for earlier attempts, would have saved quite some time.
But time to make the most of this incredible election database we've built now.
This is genuinely coming out very late, but I've finally harnessed the multi-headed hydra that is terabytes unclean election data (curses), and today spent time analyzing all of it.
First research report released, an insight no one has apparently yet stumbled upon.
More, and more reports coming out in droves all night! And the final predictive modelling results tomorrow morning. Though many polling has already been released, and D advantage obvious, the early votes have been heavily consistent voters. High-propensity republicans are voting at the same pace as earlier years, but democrats are drawing down their pool faster.
I'm also super happy with this first report, because of how I made the charts represent intentions which is a hint for what Carmena's Overton Research will look like. In this chart bunched together dots indicate less rural/urban polarity, and the more left the more partisan and polarized an election.
P.S: Upset a little with the delay, but incredibly happy this task that was absolutely mind-bogglingly stupid and delusional to even fathom just 6 days ago, I think I've managed to get done just a couple hours late... we have a fully fledged, most wholistic election database on the internet and streams will be set up for it tomorrow too. Obviously, I'm not sleeping with less than 12 hours left to election start. That's a given.
Some help from @getcontextdev and @mynameisyahia patching bugs in literally seconds. Wish I'd used it earlier to do easy 429-bypasses instead of manually building an bypass-framework for earlier attempts, would have saved quite some time.
But time to make the most of this incredible election database we've built now.
Occasional voters make up a smaller share of the early electorate than 2022.
Each dot is a county. Closer the dots are bunched, lesser the urban/rural divide. The more to the left they are, we see the election as more polarizing.
We've gotten late in the data coming out for our inaugural election model, but now we'll finally be publishing fascinating research and data all night and our predictions by tomorrow morning.
This chart: We've found unaffiliated early voting has risen 70% from 2022
-across the six battleground states charted, compared with 35% for Democrats and 23% for Republicans.
The gap is even wider among consistent voters: unaffiliated turnout rose 95%, against 35% for Democrats and 27% for Republicans.
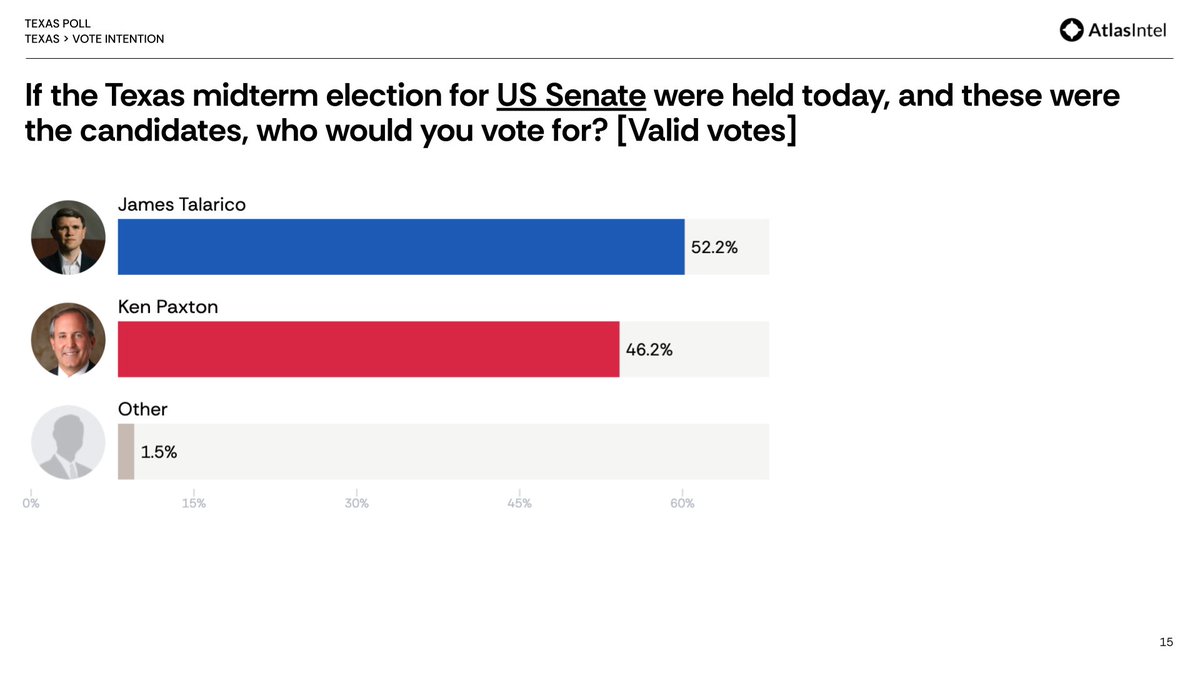
2⃣ TEXAS SENATE 2026 | Valid votes
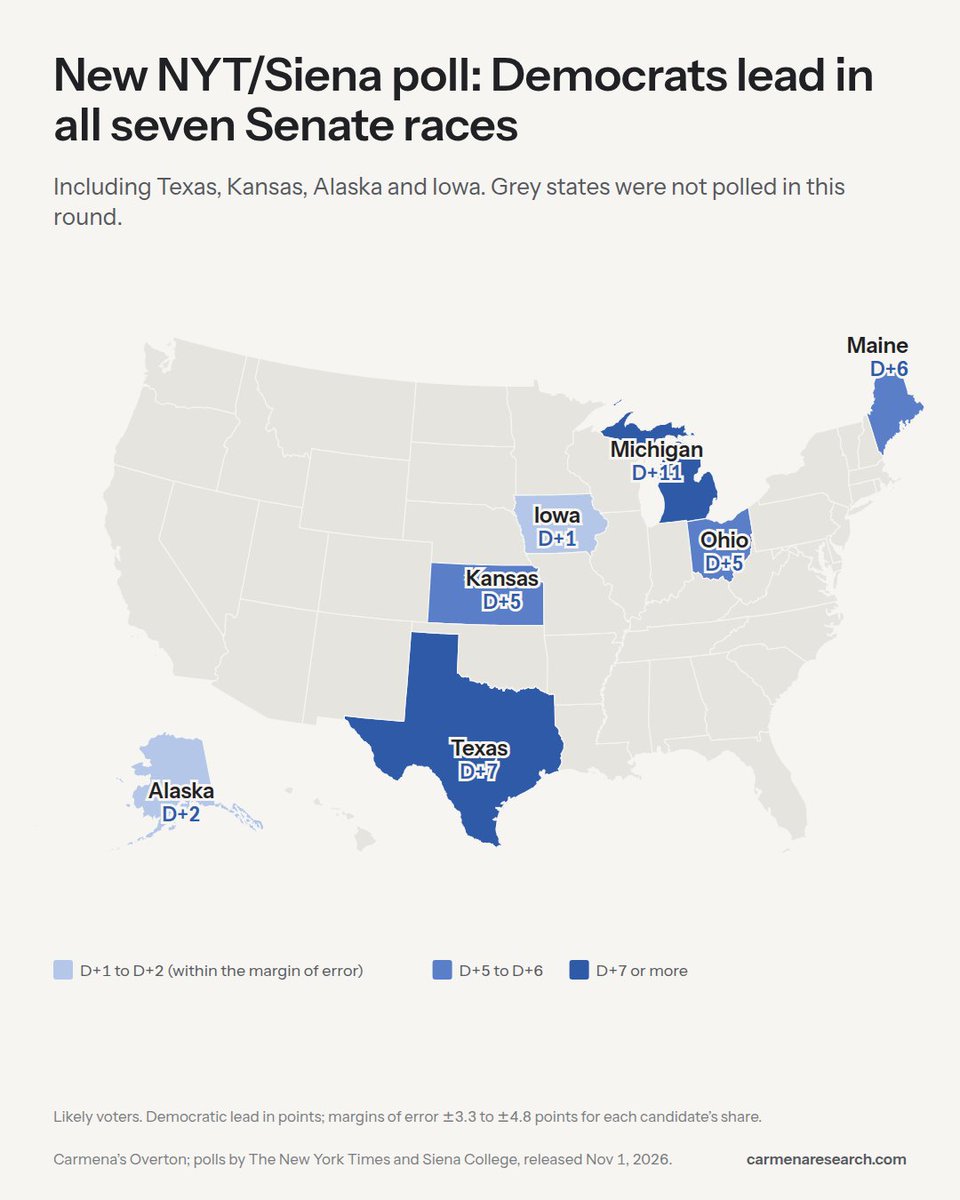
Democrat James Talarico leads Republican Ken Paxton by 6pp in the Texas U.S. Senate race.
🔵 James Talarico: 52.2%
🔴 Ken Paxton: 46.2%
🟡 Other: 1.6%
Texas's early vote has swung 11 points toward Democratic primary voters since 2022. After the last day of early voting, voters whose last primary was Democratic lead by 1.8 points, after trailing by 9.1. 212 of 253 counties moved that way; much of South Texas went the other way.
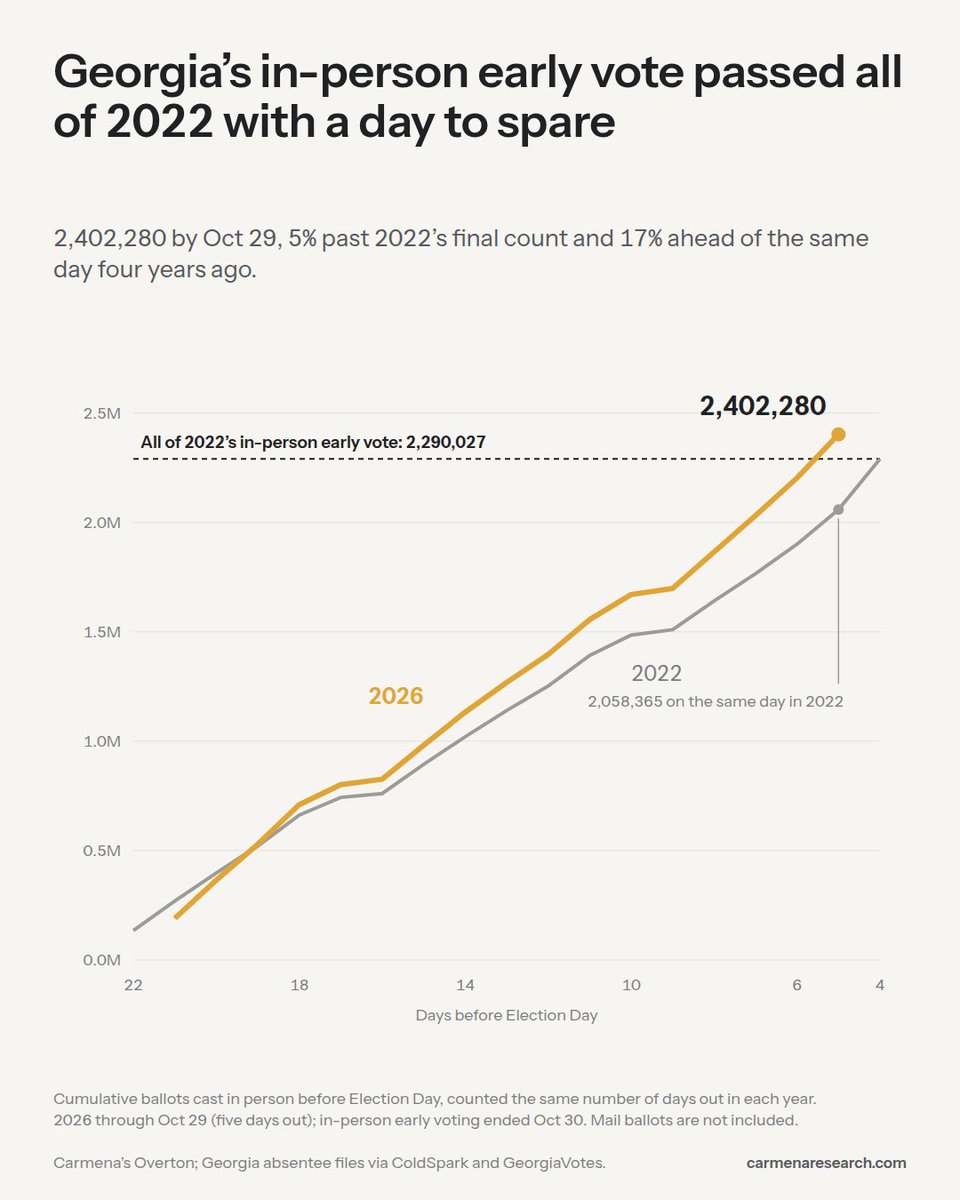
Georgia's in-person early vote passed its entire 2022 total with a day of early voting to spare: 2,402,280 ballots by Oct 29, against 2,290,027 for all of 2022 and 2,058,365 on the same day that year.
@carmenaresearch will be releasing its inaugural model for the elections on Nov 2, night before the mid-terms.
We'll be also be posting early-vote and poll trends regularly on our website, blog and socials until then.
Sign up to our Substack, and stay tuned!
Six days out, registered Democrats lead Nevada's early vote by 30,575. On the same day in 2024, registered Republicans led by 45,112, and in 2022, Democrats led by 6,484.
With four days to go, 13 states have already cast more early ballots than in the whole 2022 early vote. Wyoming and Connecticut shattered theirs, with more than two and a half times as many. Texas is at 6.1 million, 111% of 2022, and Ohio and North Carolina are within 1%.