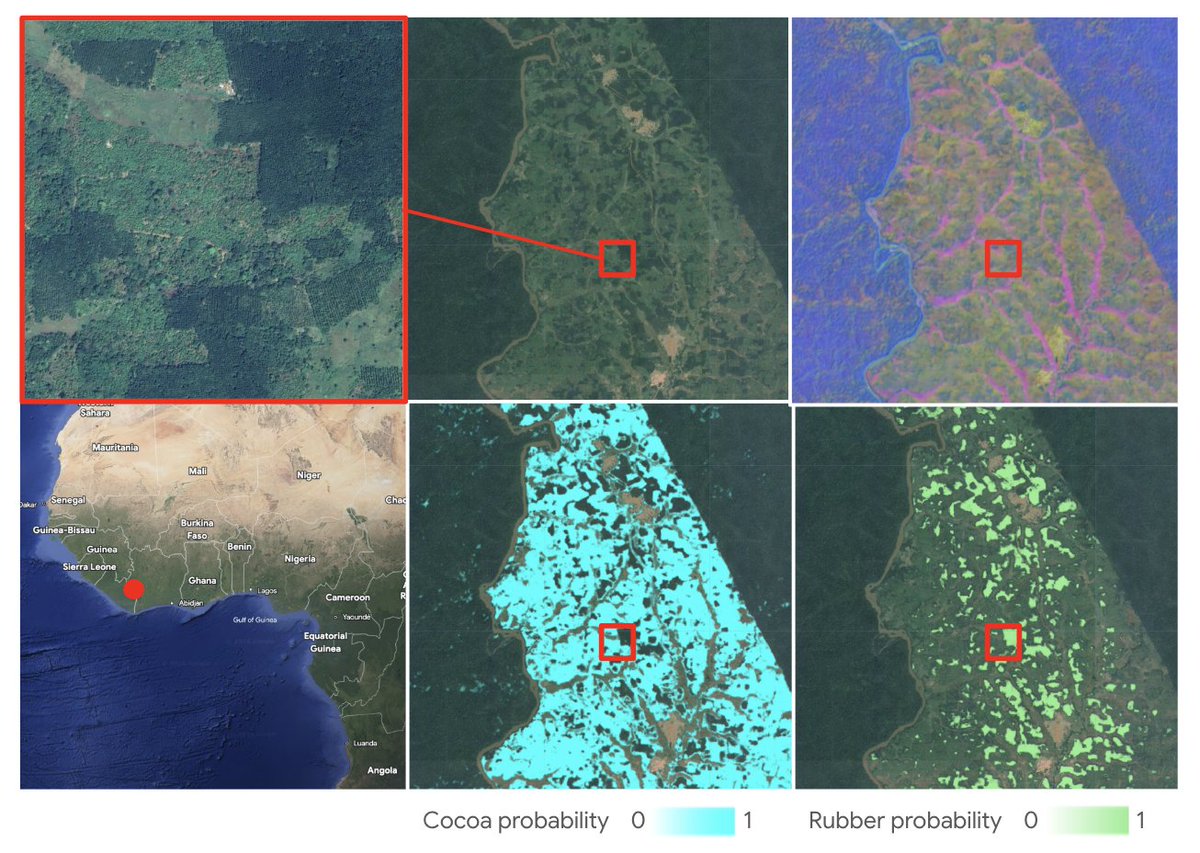
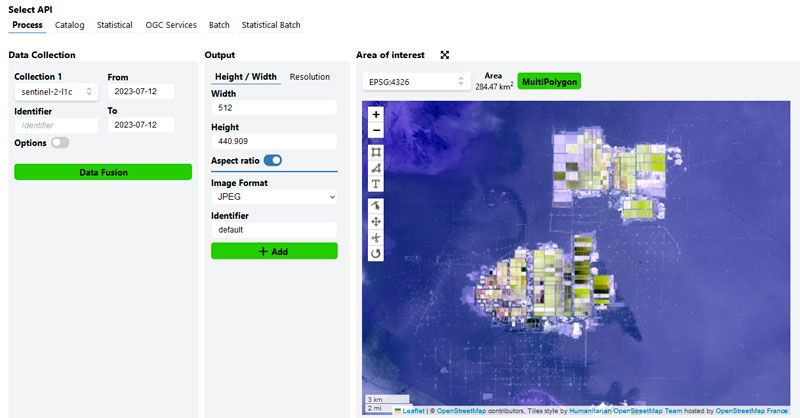
Today, we're excited to announce a major milestone in spatial transparency: the launch of annual, global commodity tree crop maps (coffee, cocoa, oil palm and rubber) built with Google’s Satellite Embedding dataset, part of Google Earth AI. https://t.co/CO5Hjvn9yK
This dataset represents the first pan-tropical, open source, 10-meter resolution map for cocoa, coffee, and rubber, key commodity tree crops associated with deforestation.
These maps are a core output of the Forest Data Partnership (FDaP), a global consortium dedicated to halting forest loss by collaboratively improving monitoring and supply chain tracking. By scaling our coverage from individual countries to the entire tropical belt, we’re closing a critical data gap that has hindered conservation efforts for decades.
ANOVA (Analysis of Variance) is a powerful statistical method used to compare the means of two or more groups. It helps to determine if there are significant differences among the group means. When applied correctly, ANOVA can provide clear insights into the variations within your data.
✔️ Uncover Hidden Patterns: ANOVA allows you to detect differences in group means, helping you understand the underlying patterns in your data.
✔️ Informed Decision-Making: By identifying significant differences, ANOVA supports more informed decisions based on data analysis.
✔️ Efficiency in Testing: ANOVA can test multiple groups simultaneously, saving time and reducing the risk of Type I errors.
❌ Misinterpretation Risk: If assumptions like normality or homogeneity of variances are not met, ANOVA results may be misleading.
❌ Complexity in Large Data Sets: Handling large data sets or multiple variables can complicate ANOVA, requiring careful management to avoid errors.
🔹 R: Use the aov() function for performing ANOVA, and ggplot2 for creating insightful visualizations like density plots to represent the distribution of groups.
🔹 Python: Utilize the statsmodels package to conduct ANOVA and seaborn or matplotlib for creating density plots and other visual aids.
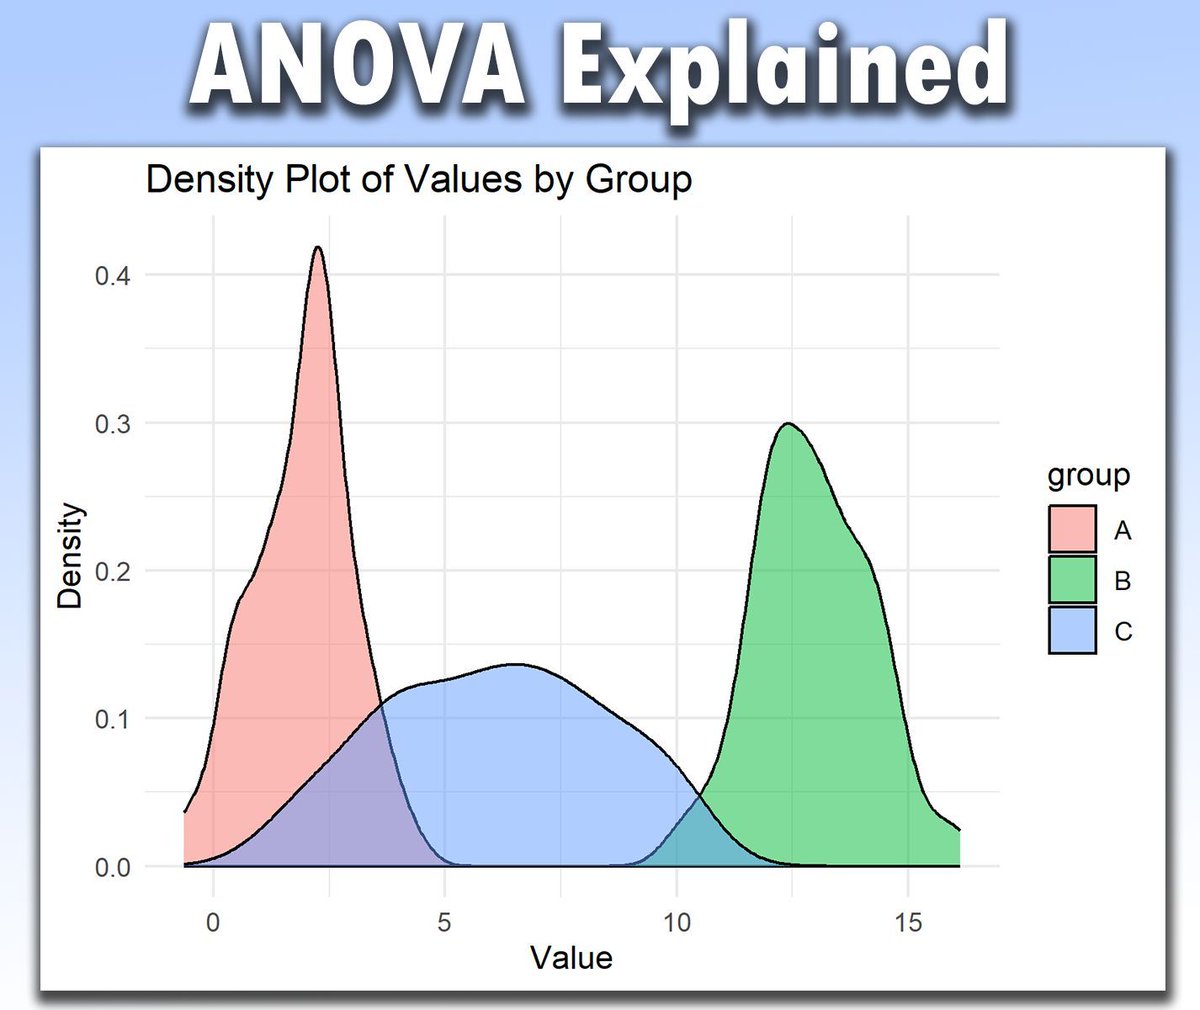
In the attached visualization, a density plot is shown based on three groups (A, B, and C). Such a density by group plot is a useful complement to ANOVA as it enhances your understanding of the group distributions and the assumptions underlying the analysis. In this example, the plot shows different variances among the groups, suggesting we should assess if ANOVA is appropriate or if its assumptions are violated.
For those interested in diving deeper into Statistical Methods, including ANOVA, check out my online course on Statistical Methods in R. This course covers this and many other related topics in detail.
See this link for additional information: https://t.co/7YQCRDKSPO
#Statistics #Rpackage #DataAnalytics #datastructure #RStats #tidyverse #DataVisualization #R #StatisticalAnalysis #DataViz
Anyone with an internet connection can learn data analysis for free:
Excel - Microsoft Training Videos
https://t.co/PPcI4auxmt
SQL - Mode
https://t.co/cWkJX804Se
PowerBI - Udemy Course
https://t.co/CyUt7gn4pT
Python - Google Classes
https://t.co/BgIRYkpFyK
No more excuses.
Change Detection Method for Remote Sensing Images Based on Google Earth Engine
Tutorial Link: https://t.co/r01EAjRS3K
Registration open:
For more details visit our website:
https://t.co/i4EFoxX5HU
#gee#googleearthengine#gis#geospatial
5 Best Courses for Data Structure
1. Data Structure - https://t.co/ky6WW96vg3
2. Algorithms - https://t.co/8hLTpRuyLw
3. Visual Introduction to Algorithms- https://t.co/IHDqDfsj0R
4. Introduction to DSA - https://t.co/dKalO00Vwg
5. Data Structure in Java- https://t.co/Y3hkwyskzj
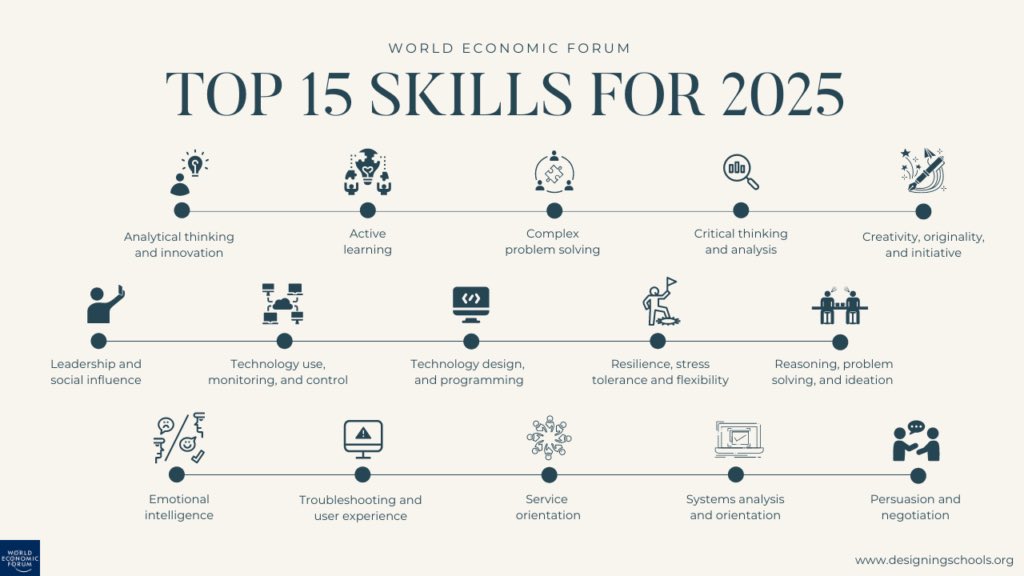
Some of the top skills for 2025:
1 Analytical thinking and innovation
2 Active learning and learning strategies
3 Complex problem-solving
4 Critical thinking and analysis
5 Creativity, originality, and initiative
6 Leadership and social influence
7 Technology use, monitoring, and control
8 Technology design and programming
9 Resilience, stress tolerance, and flexibility
10 Reasoning, problem-solving, and ideation
11 Artificial intelligence and machine learning
12 Cloud computing
13 Blockchain
14 Cybersecurity
Everyone is talking about SWOT, PESTEL, VRIO and Porter's 5 Forces.
But nobody is showing you how to use them.
Here's a checklist with 12 Essential Strategic Frameworks you Need to Know.
And the steps to take so you can actually use them in your organization.
⏬⏬⏬
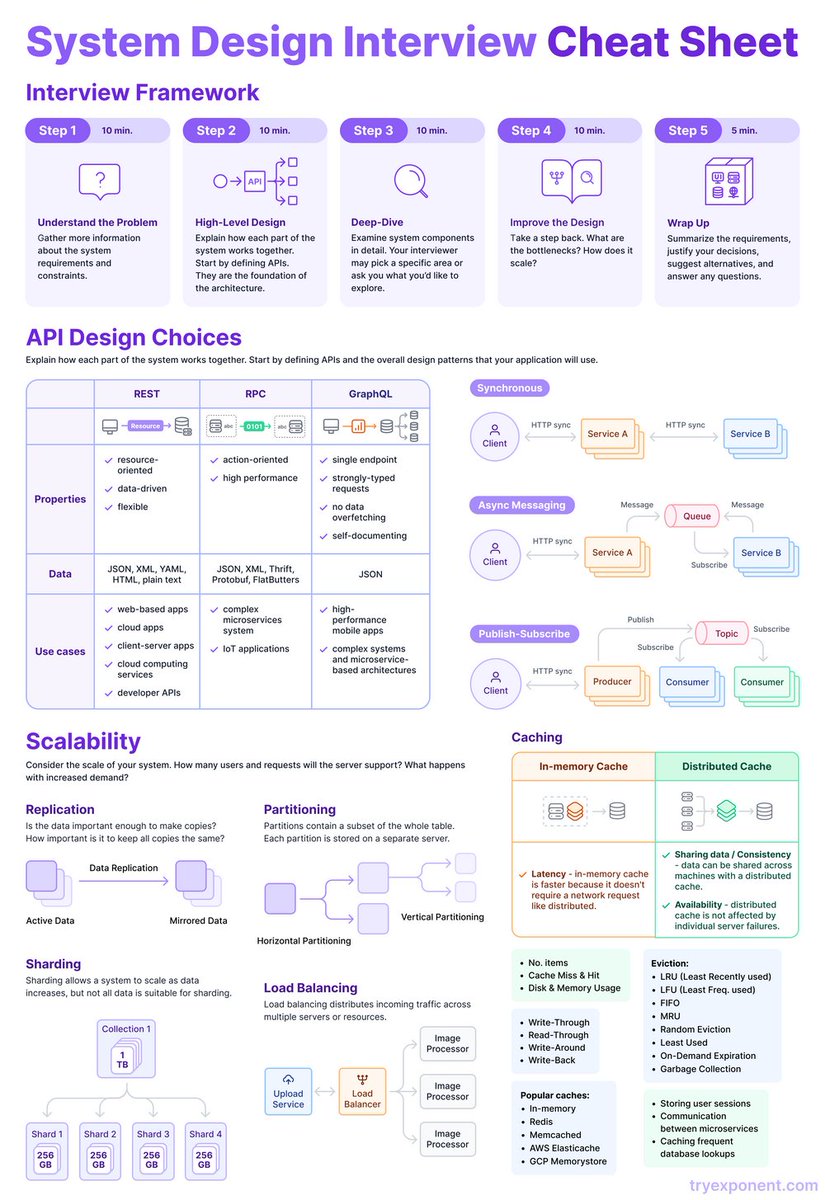
I have created a GitHub repository to help you learn system design weeks ago.
And it received 450+ stars on GitHub.
I've added many case studies to make it easy for you
It gives you:
- System design interview tips
- System design fundamentals
repo - https://t.co/3Cr8WQHBVy