🚨 Zelensky’s longtime business partner Timur Mindich fled Ukraine to Israel on a private jet with 800kg of gold + millions in cash — just hours before NABU raided his home.
https://t.co/YWAsdJHipd
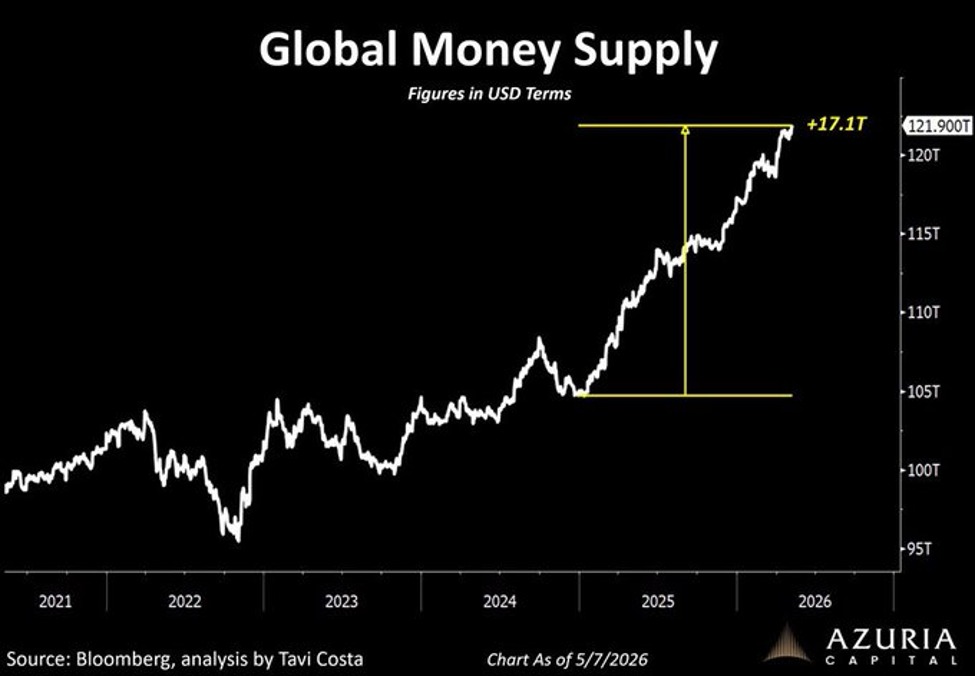
Money supply is skyrocketing:
Global money supply is now up to a record $121.9 trillion.
Over the last 2 years, money supply has soared +$17.1 trillion, or +16%.
This also marks a +$27 trillion increase, or +28%, since the 2022 low.
This means that global money supply is surging +7% to +8% a year.
Meanwhile, US M2 money supply jumped +$1 trillion YoY, or +4.6%, to a record $22.7 trillion.
Money supply growth is accelerating.
📌 Stop selling too early.
Institutions leave footprints in the form of Fair Value Gaps (FVGs).
Supply Zone → Displacement → FVG → Retest → Entry
Learn to trade the imbalance, not just the zone. 💎
🇺🇸 Marco Rubio mealen:
“Doların Saltanatı 5 yıl İçinde Bitebilir”
➖ Bugün bizim yarım küremizde, güneyimizdeki en büyük ülke olan Brezilya, Çin ile bir ticaret anlaşması yaptı.
➖ Bundan sonra ticareti kendi para birimleriyle yapacaklar ve doğrudan dolardan kurtulacaklar.
➖ Dünyada tamamen Amerika Birleşik Devletleri'nden bağımsız ikincil bir ekonomi yaratıyorlar.
➖ Beş yıl içinde yaptırımlardan bahsetmemize gerek kalmayacak.
➖ Çünkü dolar dışındaki para birimleriyle işlem yapan o kadar çok ülke olacak ki, yaptırım uygulama kabiliyetimiz kalmayacak.
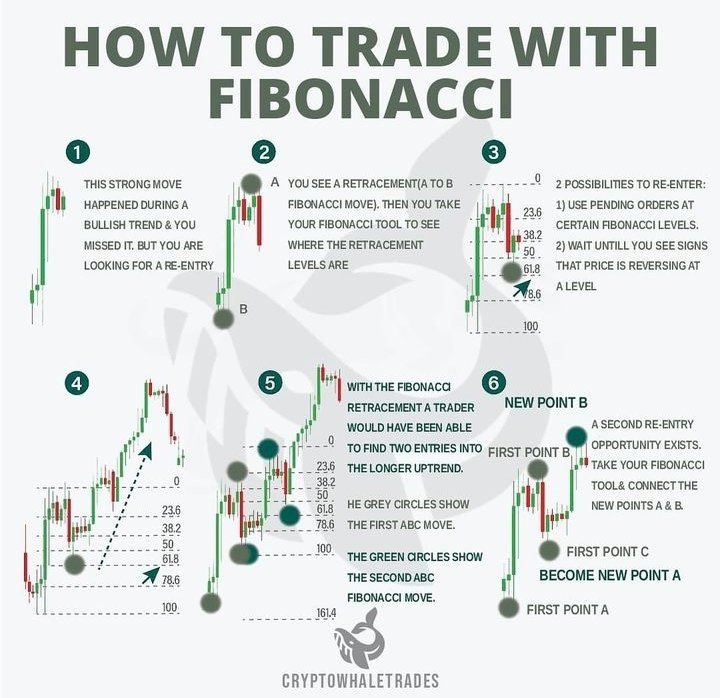
HOW TO TRADE WITH FIBONACCI RETRACEMENTS:
Trading using Fibonacci levels: is a popular technique in technical analysis that involves identifying potential support and resistance levels based on the Fibonacci sequence.
Here’s a step-by-step guide on how to trade Fibonacci retracements and extensions effectively.
1. Understand Fibonacci Basics
Fibonacci trading relies on key ratios derived from the Fibonacci sequence (e.g., 0.236, 0.382, 0.50, 0.618, and 0.786). These ratios help identify levels where price corrections (retracements) or extensions may occur.
2. Identify a Strong Trend
Before applying Fibonacci tools, identify whether the market is in an uptrend or downtrend. This is critical since Fibonacci levels are most effective in trending markets.
Uptrend: Look for higher highs and higher lows.
Downtrend: Look for lower highs and lower lows.
3. Use the Fibonacci Retracement Tool
The Fibonacci retracement tool is used to identify levels where the price may pull back (correct) before resuming the trend.
Steps:
1. Select a Swing High and Swing Low:
For an uptrend: Draw the Fibonacci retracement tool from the swing low (start of the trend) to the swing high (end of the trend).
For a downtrend: Draw from the swing high to the swing low.
2. Observe Retracement Levels: Key levels to watch: 0.382 (38.2%), 0.50 (50%), 0.618 (61.8%), and 0.786 (78.6%).
3. Wait for Price Action Confirmation: Monitor how the price reacts at these levels. If the price shows a reversal pattern (e.g., candlestick patterns like doji, engulfing, or pin bar), it may indicate the continuation of the trend.
4. Plan Your Trade
Entry:
Buy in an Uptrend: Enter near a Fibonacci support level (e.g., 61.8%) when price shows signs of reversal.
Sell in a Downtrend: Enter near a Fibonacci resistance level.
Stop-Loss:
Place a stop-loss slightly below the Fibonacci level you’re trading from (e.g., below the 61.8% retracement).
Take-Profit:
Use Fibonacci extension levels (1.272, 1.618) to set profit targets.
5. Use Fibonacci Extensions for Targets
Fibonacci extensions project potential profit levels when a trend resumes.
Steps:
1. Select a swing high and swing low (for
Sono passati quasi quattro anni dall'inizio di questo governo e Giorgia Meloni non ha mantenuto una sola promessa elettorale. Il fallimento del referendum sulla giustizia è solo l'ennesimo disastro di un esecutivo formato da incapaci, bugiardi e cialtroni criminogeni.
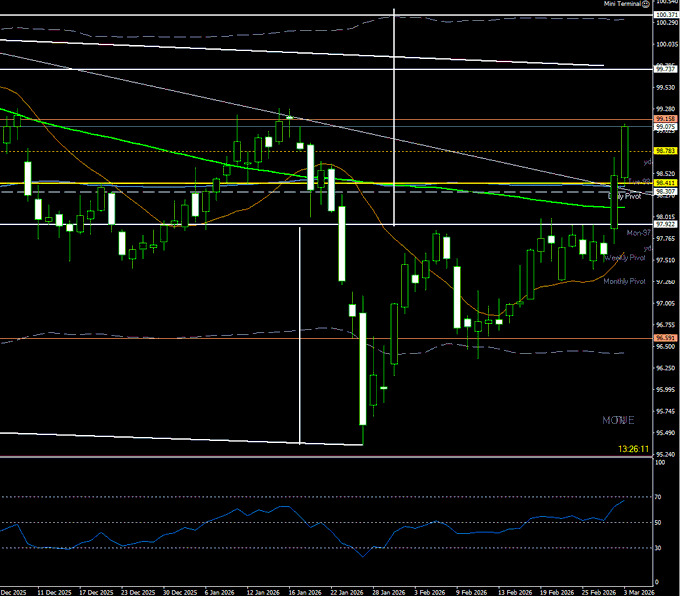
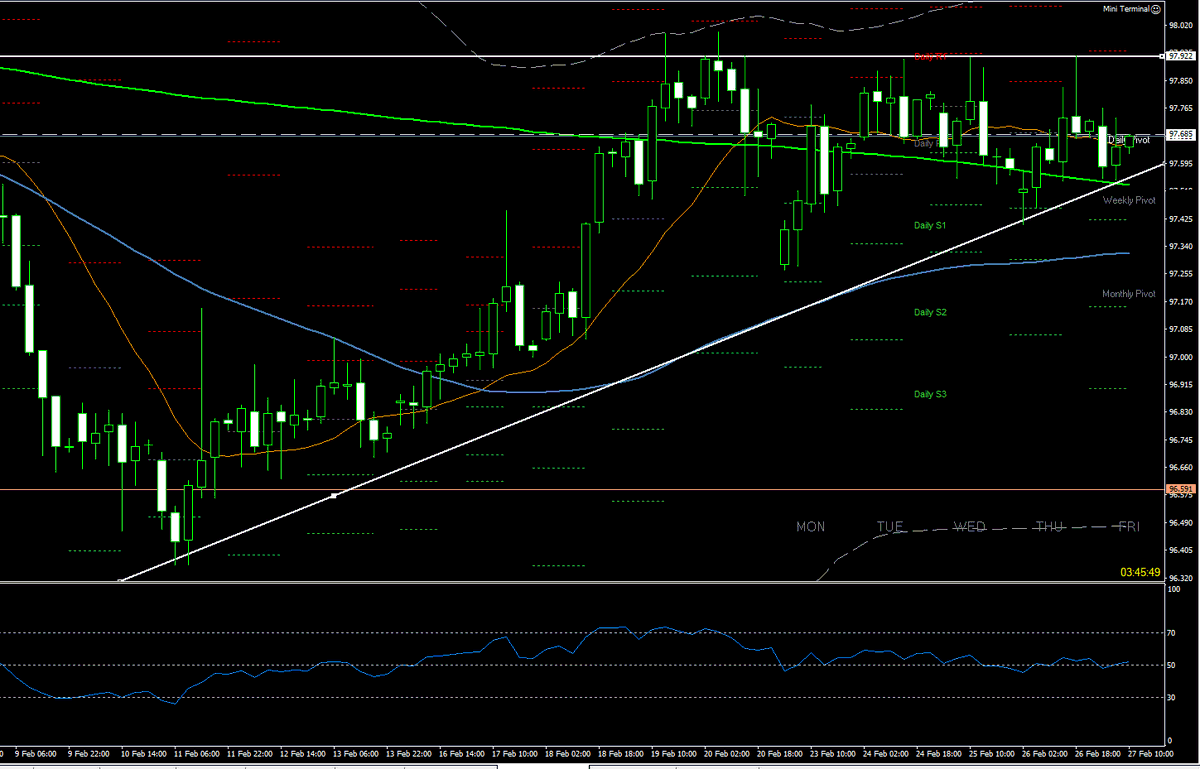
$USDX Dollar Index 4H chart: Triangle pattern broken; towards next static resistance @99.15 and in extension towards dynamic resistance @99.70 area...!!
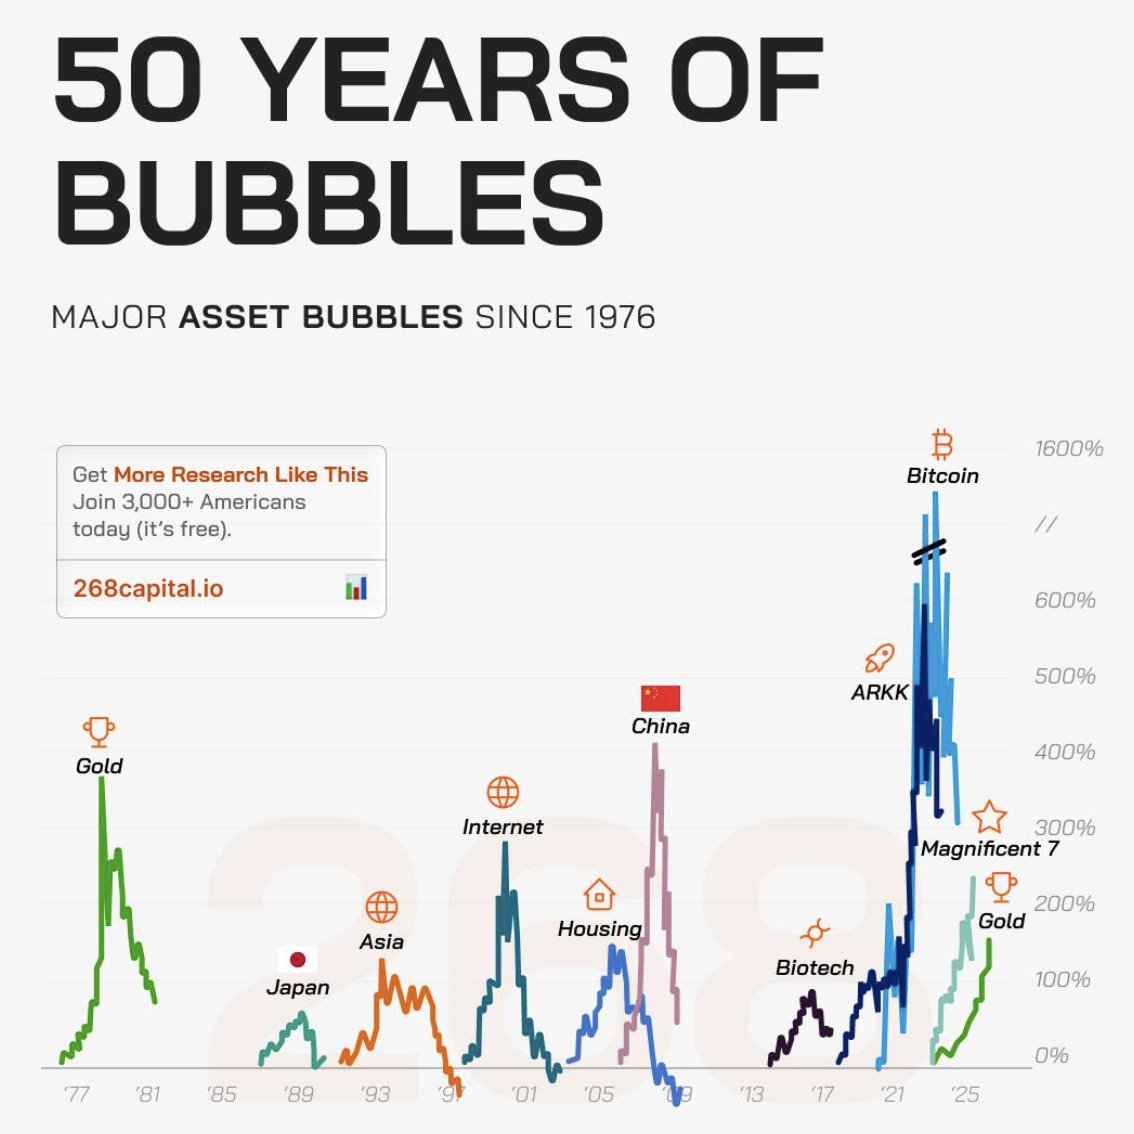
Fifty years. Same movie. Different ticker.
Gold in the late 70s. Japan in the 80s. Asia in the 90s. The Internet in 2000. Housing in 2006. China in 2008. Biotech in 2015. ARKK, Bitcoin, and now the Magnificent 7.
Every cycle has a story that feels different. Revolutionary. Structural. This time is smarter. This time is permanent.
Price goes vertical. Narratives get louder. Risk management gets quieter.
Then gravity shows up.
The takeaway is not that innovation is fake. It is that parabolic moves rarely sustain without resets. Excess always gets wrung out.
Bubbles are not about bad assets. They are about stretched expectations and crowded positioning.
If you trade long enough, you stop asking “Is this different?”
You start asking, “Where are we in the cycle?”
🏆 Un milione di secondi fa era il 29 gennaio.
Un miliardo di secondi fa era il 1994.
Un trilione di secondi fa erano 30.000 anni a.C.
Il debito pubblico americano aumenta di un trilione ogni 6 mesi.
- Gli Stati Uniti stanno scivolando su una pendenza fiscale. Cioè, il nostro debito sta crescendo più velocemente dell'economia.
- Sembra che questo vi preoccupi seriamente.
- A lungo termine, certo. Infatti, in pratica stiamo prendendo in prestito denaro dalle future generazioni di americani. È giunto il momento di tornare a quei limiti fiscali con cui possiamo vivere. E prima lo faremo, meglio sarà.
Il capo della Federal Reserve statunitense, Jerome Powell, ha detto questo nel febbraio 2024, quando il debito pubblico americano era di 34,4 trilioni di dollari. Sono passati due anni. Ora il debito pubblico americano è di 38,6 trilioni di dollari. L'aumento è stato di 4 trilioni in 2 anni.