The last time an El Niño this strong hit, it killed 50 million people. That was 3 to 4% of the entire world population. Scale that to today and you're looking at 250 million equivalent.
The 1877 Super El Niño triggered simultaneous droughts across India, China, Brazil, and East Africa. Crops failed on four continents at the same time. The famine lasted three years. Researchers have called it "arguably the worst environmental disaster to ever befall humanity."
NOAA's latest update gives a two-in-three chance this one reaches strong or very strong by fall. European models are even more aggressive. Sea surface temperatures need to exceed 2°C above normal to qualify as "super." The trajectory is pointing directly at that threshold.
Here's what makes 2026 structurally different from every previous Super El Niño: there are two independent supply shocks converging on the same crop cycle.
The Iran war has shut down roughly a third of the world's seaborne fertilizer trade through the Strait of Hormuz. US fertilizer supply was at 75% of normal in mid-March, right when the Corn Belt needed it most. Fertilizer prices hit their highest level since 2022. That input shortage is already baked into the 2026 growing season.
The El Niño yield shock operates on a 6 to 12 month lag. India is forecasting below-normal monsoons for the first time in three years. Indonesia and Malaysia carry 90% of global palm oil, and El Niño production declines in those countries take 6 to 24 months to peak. Every strong El Niño in the past 55 years has reduced global cocoa production.
So the fertilizer shortage weakens the crops El Niño is about to stress, and the El Niño yield collapse hits in 2027 on fields that were already under-fertilized in 2026. Two shocks with nearly identical lag structures, converging on the same harvest window.
The difference between 1877 and 2026: we can see this one coming six months out. The commodity futures curve is barely pricing either shock. Whether that's rational discounting or willful denial depends entirely on what the Pacific Ocean does between now and October.
How can the Philippines hope to attract foreign investments in manufacturing and high-tech industries when it can't even keep the lights on?
And when the lights do manage to stay on, paying for that basic service costs more than what people spend to put food on the table each month.
"The grid operator said 30 power plants were unavailable, while 14 others were operating on derated capacities, leaving 4,160 MW inaccessible to the grid."
https://t.co/J9Er1lPvAl
Upgrading and modernizing the entire Luzon power grid system will cost up to P460 billion according to the National Grid Corporation of the Philippines (NGCP).
That's less than half the amount estimated to have been stolen or lost as a result of the Flood Control scandal.
Just saying.
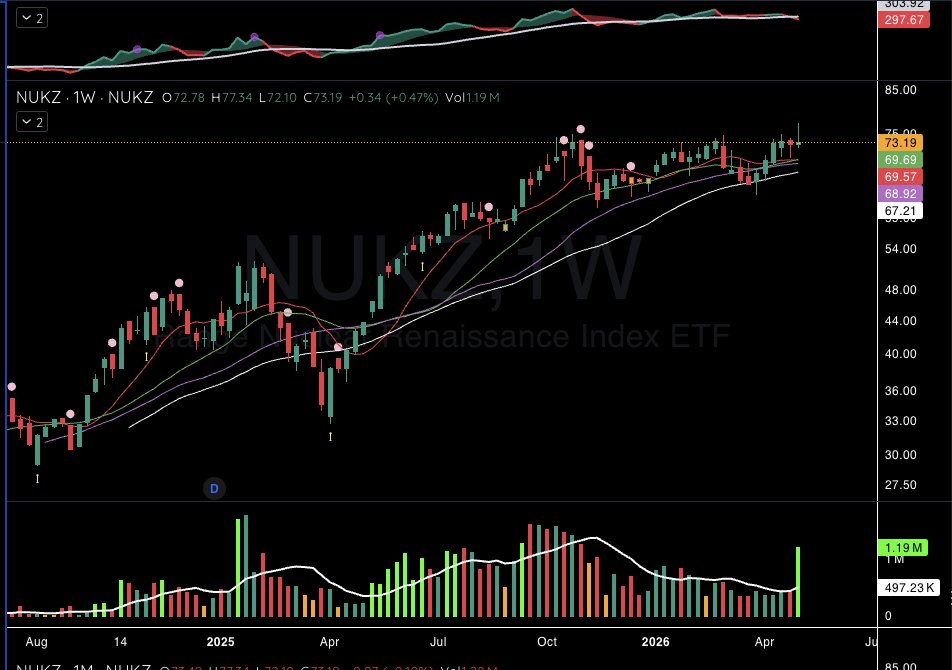
Taiwan is BIGGEST winner of the ceasefire.
And also South Korea. Why? Well, chips, chips, chips!!! These two stock indices are very chip heavy.
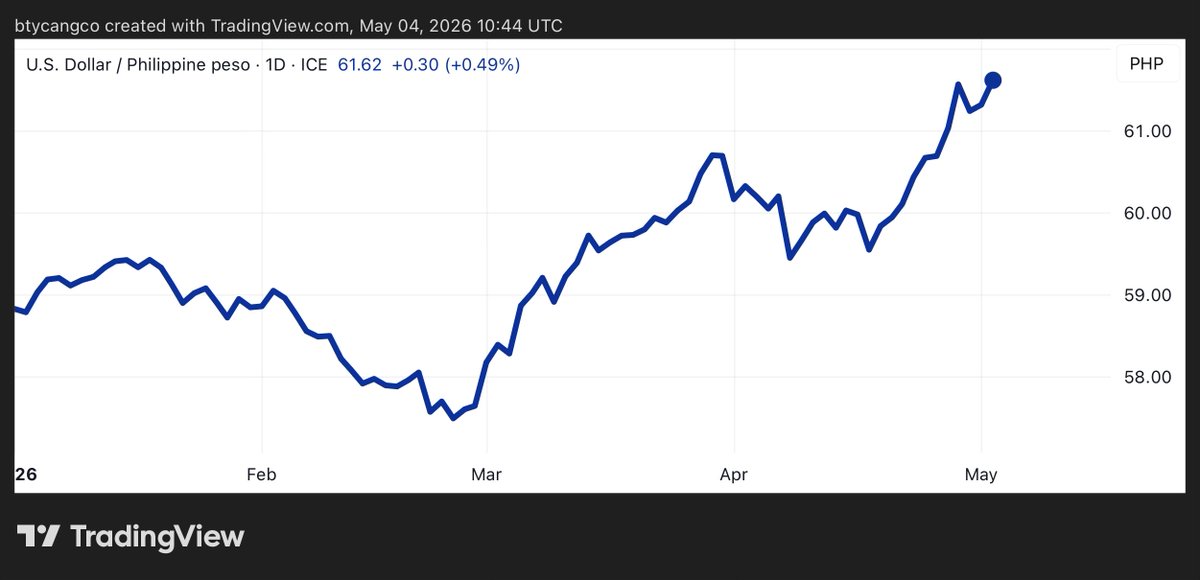
Meanwhile, the Philippines continued its losses despite news of ceasefire. Why? Well, not so much AI hardware gains and a lot of pain from the Iran War still.
BREAKING 🚨: Diamonds
Diamonds may be a girl's best friend but they're your portfolio's worst nightmare. Prices have fallen to their lowest level this century!
NATIONAL SECURITY CHEAT SHEET
Nuclear
• $OKLO micro nuclear power for data centers and defense
• $LEU enrichment for advanced reactors
• $BWXT nuclear hardware for naval and defense
• $UUUU domestic uranium mining and fuel cycle
• $CCJ uranium supply for Western fleets
Energy Storage
• $BLDP fuel cells for backup power
• $EOSE long duration zinc storage
• $TSLA grid scale batteries
• $MVST batteries for fleets and defense
• $ABAT battery recycling
Critical Materials
• $USAR domestic rare earths
• $UAMY antimony for munitions
• $FCX copper for electrification
• $CRML diversified critical metals
• $IVN base metals for infrastructure
• $MP rare earth mining and magnets
The Breakout Strategy: $TSLA
I only care about two things:
- Is there a clear pattern?
- Is price reclaiming the 21EMA?
The Pattern:
Stock consolidates - price moves sideways in a range. Then it breaks OUT of the consolidation phase. That's your breakout.
When Tesla breaks out and it is above 21EMA - I am in.
The 21EMA:
If the EMA is near price- I will enter.
If Not: I stay away and watch for a pullback
Final Pice:
Post breakout- Tesla likes to trend.
Using 21EMA allows you to stay in in the trend.
I've analyzed Tesla every week for years. If I'm taking a position trade, it's based on this setup.
Pattern + 21EMA. That's it.
Save this.
We own China
We own Uranium
We own Energy
We own Solar
Think about diversification & future leaders.
Think about what's happening in next 12-18 months.
Someone DM’d me today and we had a good chat.
Sharing this because it’ll help more than just one person.
Stop losses aren’t negative.
They’re there to keep small losses from turning into big ones.
They force you to follow a process,
instead of saying “I’ll just wing it.”
They build discipline
and discipline is what makes consistent returns possible.
Getting stopped out isn’t personal.
It’s often just the market saying the timing is off because of broader conditions.
Next time a stop hits, ask yourself:
how many times has a 5% loss saved you
from a 20% drawdown?
That perspective changes everything.
$BABA This is a good start.
3/3 is coming together.
Not having exposure to China over the next few years
will likely be seen as a big mistake
in hindsight.
One of the biggest changes you’ll notice in your trading comes from focusing on the same stocks over and over.
The goal isn’t to track 200 different names every week -it’s to narrow that list down to maybe 20.
From there, you trim it even further to five or seven setups you really like.
Those are the ones you should be watching closely, trading consistently, and staying on top of price action with. As humans, it’s just not realistic to properly follow 50 stocks at once- it’s not doable.
You have to make things as easy as possible.
If you want to improve technical analysis quickly
let me show you something simple.
Bitcoin is behaving very similar
to how it did back in 2025.
Forget most indicators for a moment.
Start with horizontal lines.
Look for similar patterns.
Pay attention to breakout channels.
Those three alone will bump you TA by 50%
Silver futures down 12% off the highs now.
This is why I genuinely feel sorry for traders who ignore technical analysis.
You don’t:
Go long when things are overbought
Go short when things are oversold
That’s it.
That’s the rule.
Simplest trading truth you will hear.
The Silver Situation:
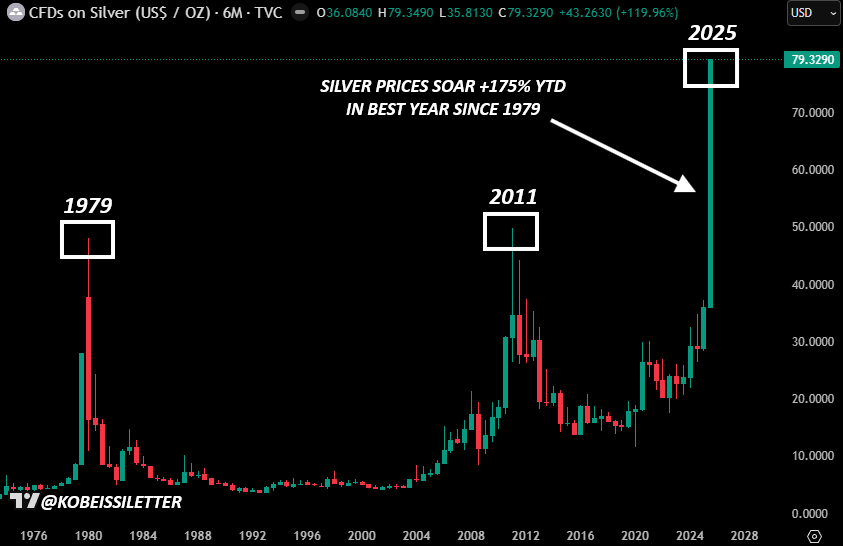
Silver prices are now up a MASSIVE +175% in 2025 and set to post an 8-month win streak for first time since 1980.
Gold and silver have added a combined +$16 TRILLION in market cap this year ALONE.
What is happening? Let us explain.
(a thread)