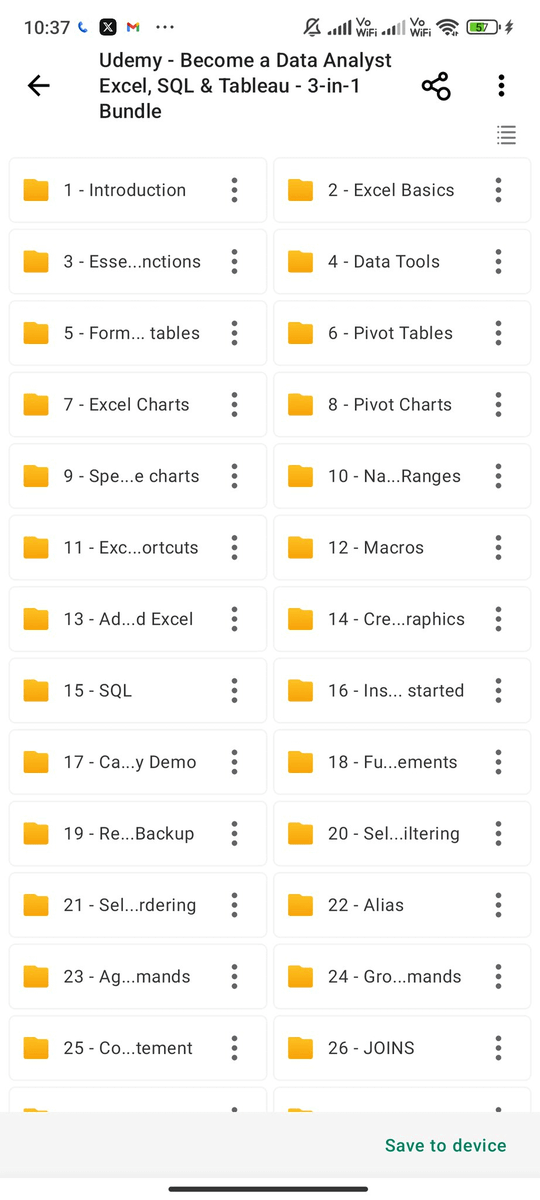
Google Drive link to learn:
-Data Analytics
-Business Analysis
-Data Visualization
-SQL
-Big Data
-Resume tips
-Project Mgt
-Product Mgt
-Software Eng
-UI/UX Design
-Interview tips and tricks
Link - https://t.co/pfrPgXQJse
Share for visibility
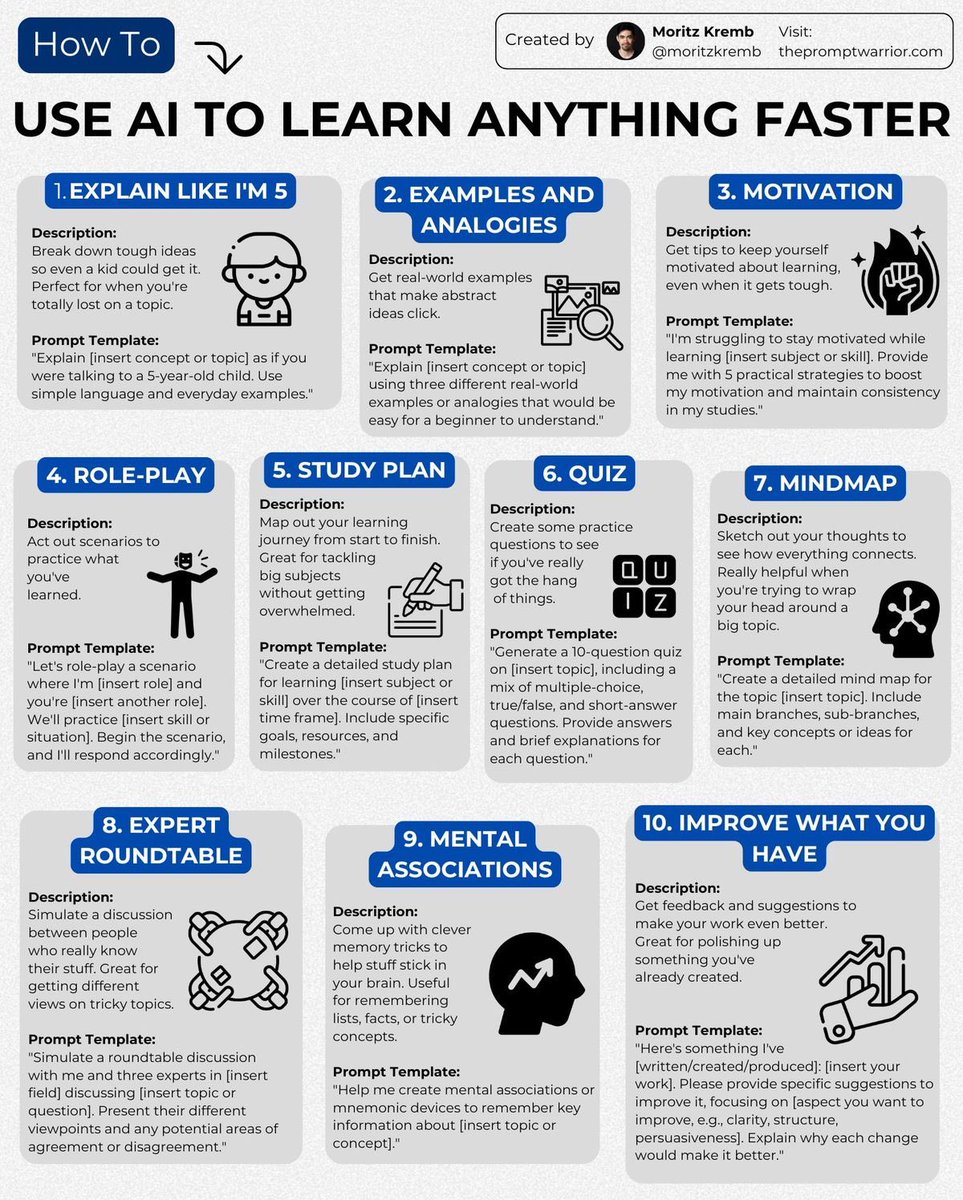
Data Analytics from Zero to Expert
A Udemy Complete Paid Course for Free for 24 Hours
Applicable for First 500 People
This Free Course Covers:
- Excel
- SQL
- Python
- R
Like , Retweet & Reply "Data" to get it for free
Must be following me so that I DM you
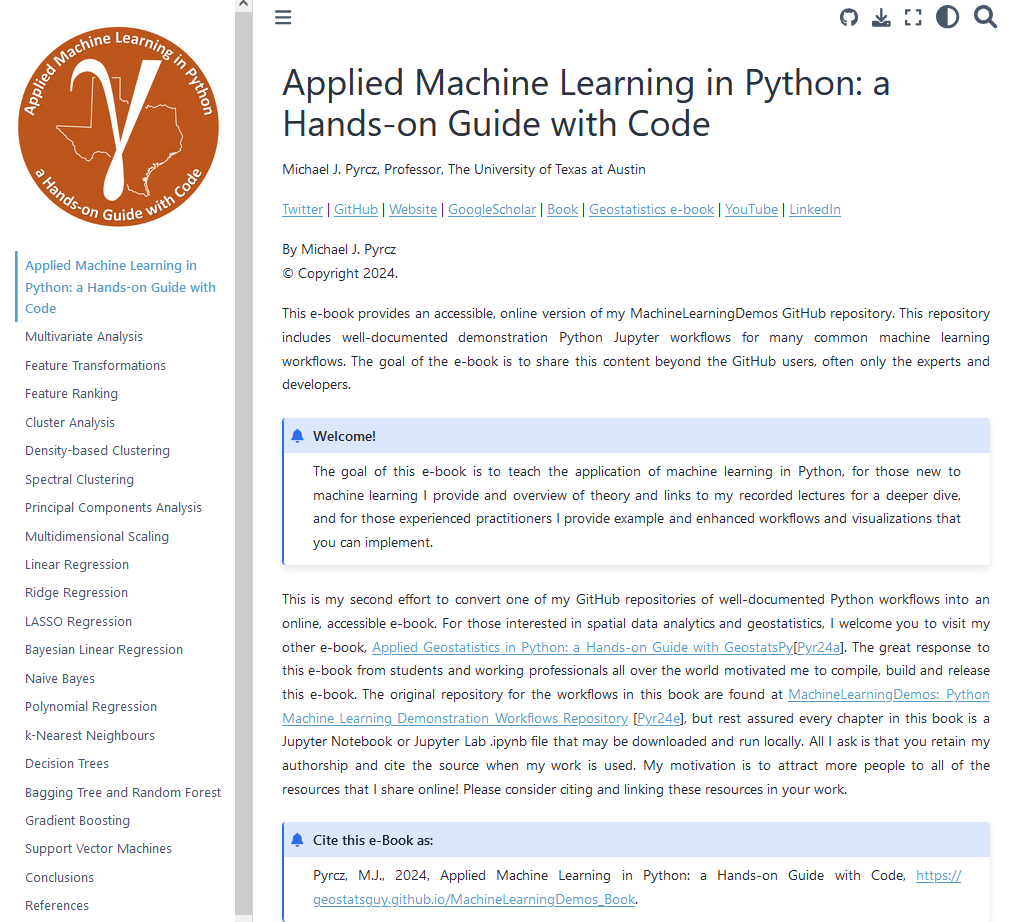
🚀 Cluster analysis is a powerful tool in inferential machine learning, but sometimes simple k-means clustering just isn’t enough. 🧐 Dive into density-based clustering in my dedicated chapter from 'Applied #MachineLearning in Python.'
My e-book is free and available to all, featuring hands-on workflows, 📊 datasets, and linked video lectures 🎥 to supercharge your learning! Try it out at https://t.co/5LwqeElPpU ∀. #DataScience
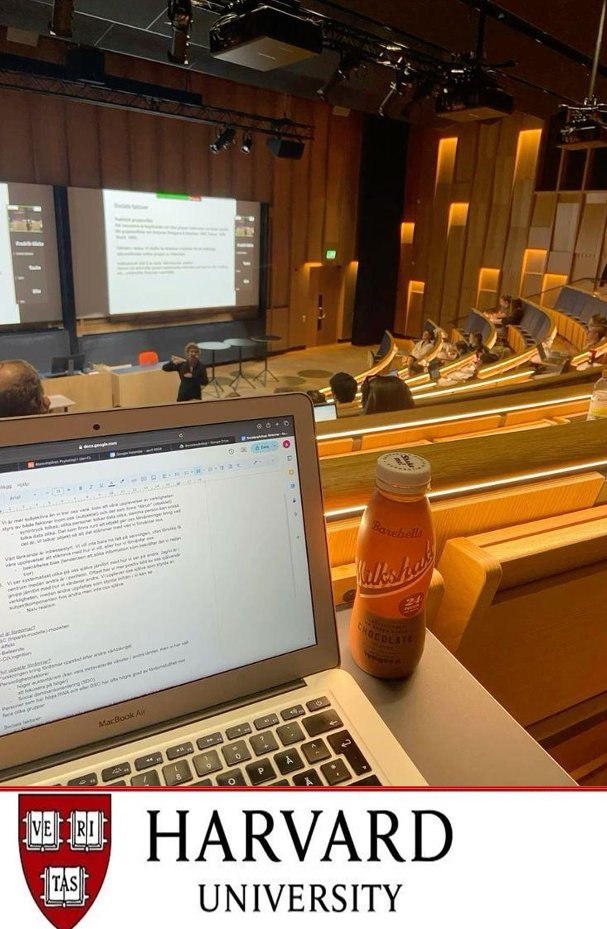
Harvard University is offering free online winter session courses
No Payment is required, just register and start learning!
12 courses you shouldn't miss:
If you missed @rladiesrome latest Tutorial - no worries!
Recording is now available for the Data Wrangling Practice with R:
https://t.co/ntomrNGppi
Read our blog post on the event and find the material:
https://t.co/yGutl30DTN
@silacos@Rafagrlucas@FGazzelloni@RLadiesGlobal
Prediction, prediction, prediction...
But I actually prefer inference! Inference allows us to extract powerful insights from our data, and it's always the foundation for making accurate predictions.
Feeling like my "Applied #MachineLearning in Python" e-book needed more emphasis on inference, I added new chapters on spectral clustering and multidimensional scaling yesterday. These updates include free, well-documented workflows, complete with data and code.
Check it out: https://t.co/kRPpZDexWa ∀. #DataScience
Our book, “Model-Based Clustering, Classification, and Density Estimation Using mclust in R” w @luca_scr, Chris Fraley & @tbmurphy is now available free at https://t.co/kxOkefhm7Y ! You can also get a paper copy at https://t.co/9CcB1o9XdD
🚀 ANNOUNCING: The release of my free and open e-book, "Applied #MachineLearning in Python: A Hands-on Guide with Code"! 🎉
🔗 Access it here: https://t.co/kRPpZDexWa
📚 16 chapters packed with well-documented #Python workflows, open-source code, and datasets — with direct links to my YouTube lectures for deeper learning! This e-book blends theory with practical coding and effective visualizations to help you understand and apply #MachineLearning concepts.
⚙️ Try the examples, explore the code, and follow along with hands-on exercises. It’s a living document, so I’ll continue adding new chapters and improving content over time.
I'm here to help you dive into #DataScience and #ML — let’s learn together! I'm having an awesome sabbatical! Stoked!
Con la charla "Rosario Castellanos. 50 años de su deceso", recuerdan trascendencia de su obra en la literatura mexicana
🔸 Es considerada una de las escritoras mexicanas más reconocidas a nivel internacional, y pionera del feminismo en nuestro país.
🔗 https://t.co/j933u2iEBF
Understanding Type I and Type II errors is the secret to unlocking the full potential of your statistical analysis.
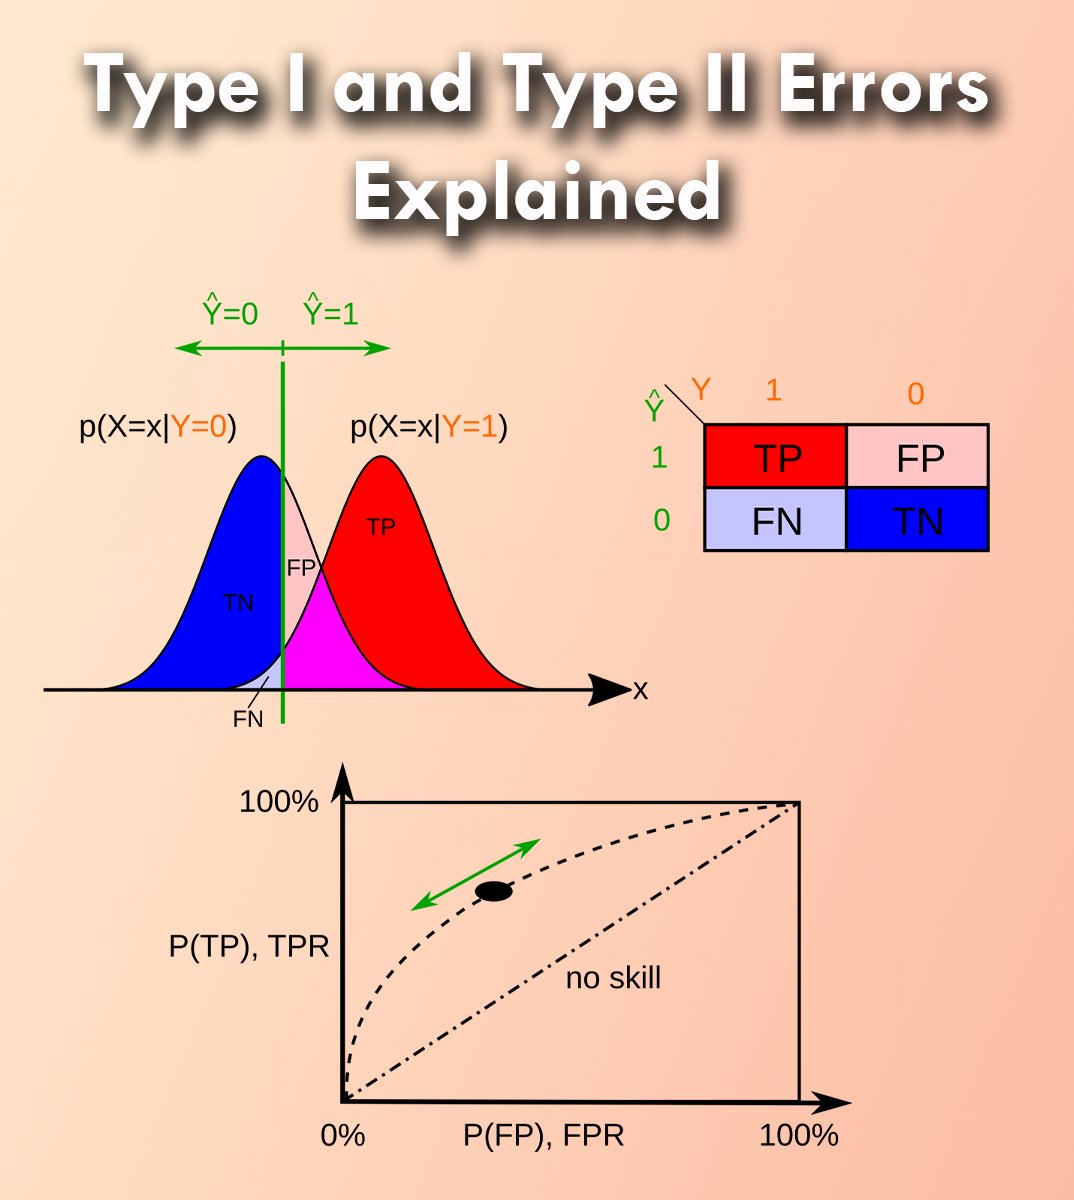
These errors are pivotal in hypothesis testing, where Type I errors represent false positives (incorrectly rejecting a true null hypothesis) and Type II errors represent false negatives (failing to reject a false null hypothesis).
Handling these errors effectively can greatly improve the accuracy and credibility of your analyses. By meticulously managing these errors, you can ensure your statistical conclusions are both reliable and valid, ultimately leading to more trustworthy and impactful research findings.
Cons of Mismanaging Type I and Type II Errors:
❌ Misleading Results: High rates of Type I errors can result in false claims of significance, leading to incorrect conclusions.
❌ Missed Discoveries: Excessive Type II errors can cause important findings to be overlooked, as genuine effects are dismissed as insignificant.
❌ Reduced Trust: Frequent errors undermine the credibility of your analysis, leading to mistrust in your results and decisions.
Pros of Effectively Managing Type I and Type II Errors:
✔️ Minimized False Positives: By carefully setting thresholds, you can reduce the number of false positives, ensuring that positive results are genuinely significant.
✔️ Accurate Conclusions: Proper management of Type I and Type II errors helps draw more accurate conclusions from data, enhancing the overall validity of your study.
✔️ Improved Decision-Making: With fewer errors, the decisions based on your data will be more reliable and informed.
To manage Type I and Type II errors effectively in practice:
🔹 R: Use the p.adjust function from the stats package to control for multiple comparisons and reduce Type I error rates.
🔹 Python: Utilize the statsmodels library, specifically the multipletests method, to adjust p-values and maintain control over error rates.
The visualization originates from a wikipedia image (link: https://t.co/dWj9dWx9xr) and shows the results of negative samples (left curve) overlapping with positive samples (right curve). Adjusting the cutoff value (vertical bar) helps balance false positives (FP) and false negatives (FN), impacting the rates of true positives (TP) and true negatives (TN).
To explain this topic in further detail, I collaborated with Micha Gengenbach to create a comprehensive tutorial. Click this link for detailed information: https://t.co/HeBLE1cTLt
#Rpackage #Statistics #DataScience #RStats