Unidad de apoyo de la Facultad de Agronomía USAC responsable de aplicar tecnología digital a las ciencias agronómicas, ambientales, forestales, agroindustriales
The Kruskal-Wallis test is a non-parametric method used to determine if there are statistically significant differences in the distributions of three or more independent groups based on ranks. Unlike ANOVA, it does not assume a normal distribution, making it versatile for analyzing non-normally distributed data sets.
Advantages of proper use:
✔️ Suitable for ordinal data or non-normally distributed data sets.
✔️ No assumption of homogeneity of variance, offering more flexibility.
✔️ Can be used with small sample sizes, increasing its applicability in various research settings.
Challenges if not handled correctly:
❌ Interpretation can be complex, especially if the test is mistaken for a median comparison when specific conditions aren't met (IID samples, symmetric distributions).
❌ Less powerful than ANOVA when data is normally distributed, potentially leading to less accurate results.
❌ May require post-hoc tests to pinpoint specific group differences, adding complexity.
How to apply in practice:
🔹 R: Use the kruskal.test() function from the base package to perform the Kruskal-Wallis test.
🔹 Python: Utilize the kruskal() function from the scipy.stats module for the analysis.
The visualization accompanying this post compares ANOVA and the Kruskal-Wallis test by ranks. This visualization is adapted from a Wikipedia source: https://t.co/1hRzGEFOjY
For those interested in learning more, consider joining my online course on Statistical Methods in R, starting on September 9, 2024, where we explore this topic and related methods in greater detail. More info: https://t.co/7YQCRDKSPO
#RStats #DataAnalytics #coding #statisticians #database #Rpackage
📊 El uso incorrecto de las estadísticas en investigación es más común de lo que debería, con consecuencias negativas para la toma de decisiones.
👉 Editores, revisores e investigadores deberían utilizar la lista de verificación CHAMP.
https://t.co/DXJHmFBEVd
#stats#analytics
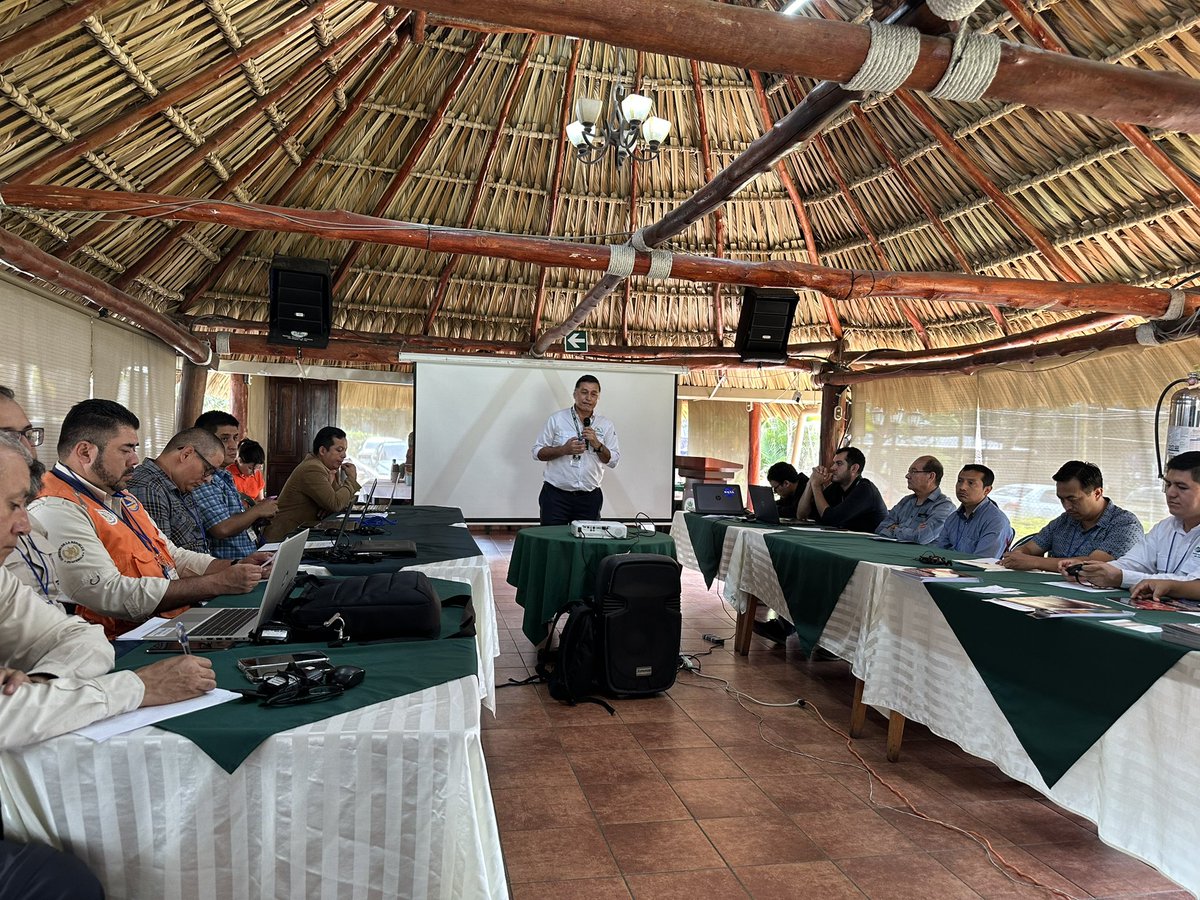
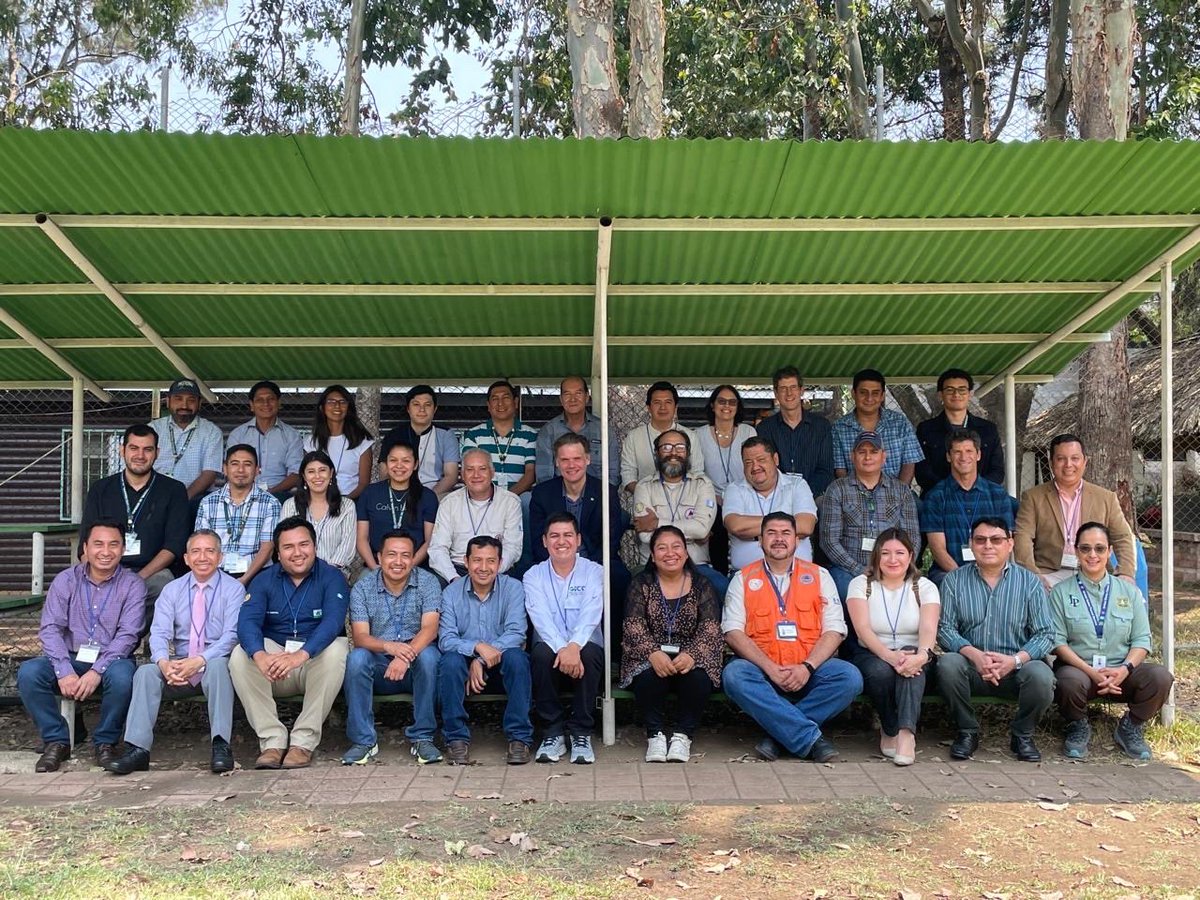
Thanks to @inabguatemala and the Guatemala Ministry of Environment and Natural Resources to host our team.
Satellite information is an excellent tool but technical expertise is the key for successful monitoring of forest fires.
Bienvenidos a la Galería de Gráficos R, una colección de gráficos realizados con el lenguaje de programación #R. Cientos de gráficos se muestran en varias secciones, siempre con su código reproducible disponible. https://t.co/AIzXabZYHn
📚💡Las revisiones de la literatura científica son el mapa para nuestras investigaciones, pero en planificación estamos un poco perdidos 🗺️
🎓Aprende a realizar búsquedas de referencias con rigor y conoce los mejores consejos.
https://t.co/U8h0M0t0Ut
#phd#research#science
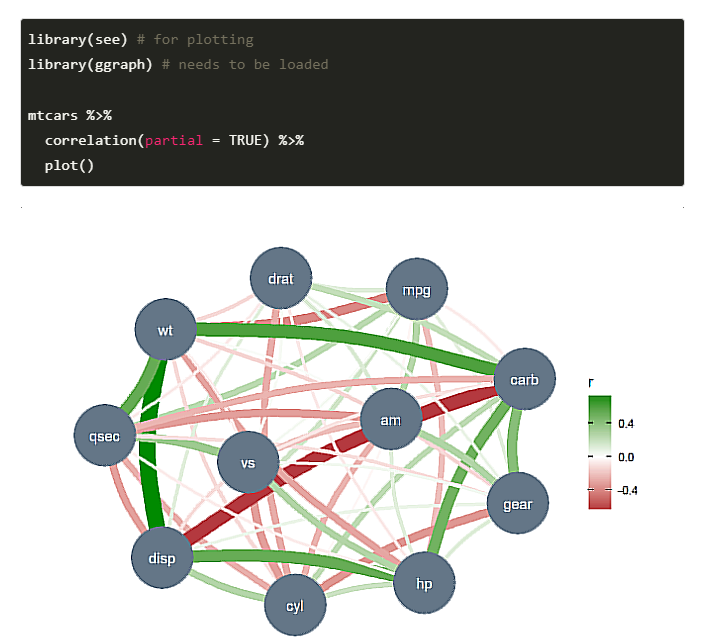
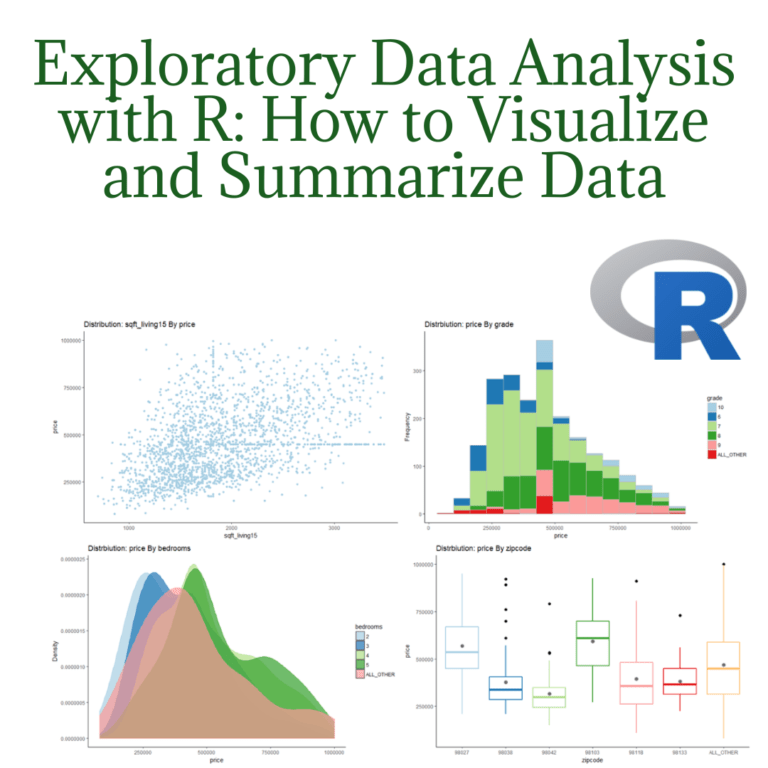
EDA is a critical step in any data analysis project. It involves the use of statistical and visualization techniques to summarize and understand the main characteristics of a dataset. https://t.co/VnIf9X61ql
#DataScience#rstats#DataAnalytics#eda#r#programming#statistics
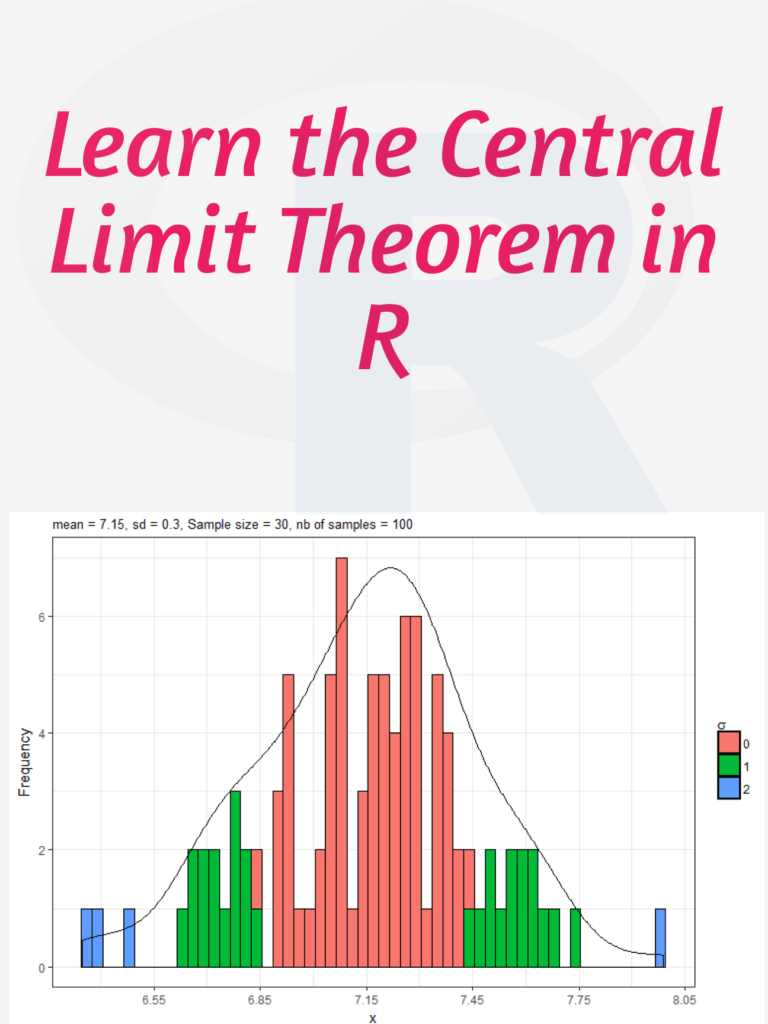
Probability distributions play a fundamental role in statistics and data analysis. They provide a mathematical description of the likelihood of different outcomes occurring in a given scenario. https://t.co/akJRYiltxL
#DataScience#rstats#probability#statistics#DataAnalytics
With https://t.co/xIwKCUofyw, you can chat with your data in plain languages. Now upgraded to v. 0.96. Fix a bug and made GPT-4 available. Interactive plots via plotly and CanvasExpress!
Cleaning data involves transforming raw data into consistent, easy-to-understand data. Data-driven statistical statements are filtered based on content and reliability based on the data. https://t.co/IyivsOVXM6
#DataScience#rstats#DataAnalytics#r#programming#dataengineering
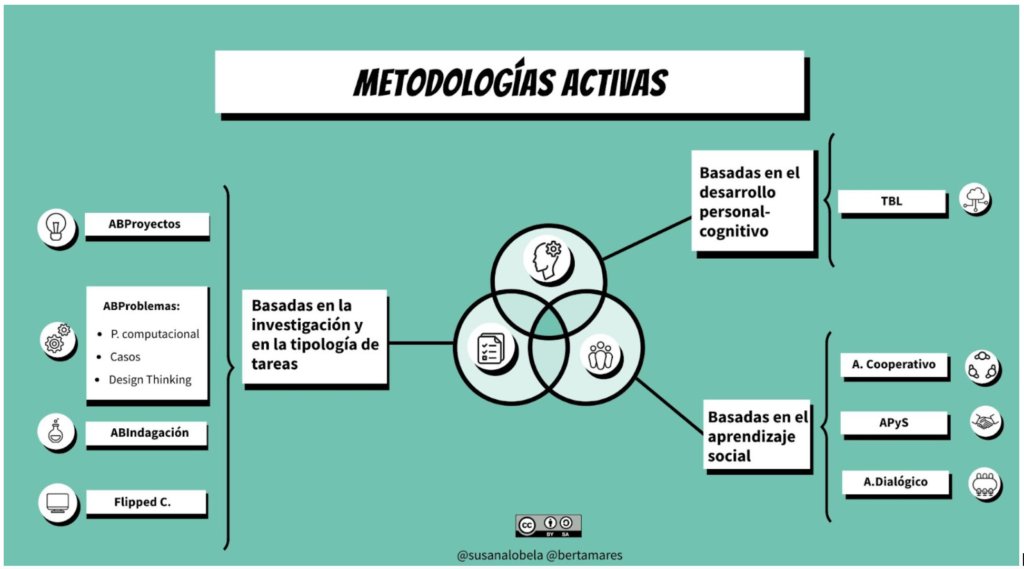
📚 ¡¡Excelente recurso!! #REA del #proyectoEDIA "Orientaciones metodológicas para la elaboración de experiencias de aprendizaje" 📢Para la reflexión y la toma de decisiones del docente en su rol de diseñador de experiencias educativas. #metodología
⬇️⬇️⬇️
https://t.co/s6uqHUtuvr
3 Quick Tricks to Rename Column Names in R!
How to change names of columns in a data frame in the R programming language (3 quick tricks).
#rstats#datascience#datamanipulation
Learning both R and Python simultaneously can be advantageous. R is renowned for its statistical analysis capabilities, while Python is versatile and widely used for data manipulation and machine learning. https://t.co/YPwxkDDZW9
#DataScience#rstats#Python#DataAnalytics#data