SPX 0DTE trader. Obsessed with backtests so you don’t have to be. Building Cashflow Engine.
Live books · research in public · no signals · losses included.
Same SPX 0DTE entry. Same strikes. Same ~$3.70 open credit on the TradeSteward trio.
Sep 24 call BTCs (ET fills I reconciled):
• one arm ~$4.15 debit
• one arm ~$4.20
• one arm ~$4.30
Seconds apart. Different exit clocks.
That's the whole experiment — not a Twitter duel about who "wins."
I'll publish the cleaned Part 2 ledger when the week is reconciled.
Losses included. No policy crowned off a single print.
https://t.co/HR40zzJemc
Portfolio construction is not "add more iron condors."
If every stream dies on the same afternoon, I didn't diversify —
I cloned risk and called it a portfolio.
What I measure: pairwise correlation on daily P&L.
What I keep: engines that disagree (premium / trend / long-gamma) and hours that don't stack.
We already ran that research stack.
You run the book — you don't re-backtest the matrix with me.
https://t.co/bB4XDQHDhV
Part 2 of the exit lab isn't a scoreboard yet.
Sep 24 (ET): same entry window, seven exit policies live.
Call side stopped across the book ~14:07.
Puts expired.
I am not crowning Lightning vs Fast vs Slow off one cluster.
I'm reconciling fills — open credit, close debit, fees, residual longs.
Losses stay in the ledger.
Setup video (Part 1): https://t.co/sH2OPvLruE
Not signals. One day ≠ a policy ranking.
I don’t want traders DIY-ing 200k backtests to “feel diversified.”
We already ran the research stack.
This video is the portfolio layer: Dalio’s chart → daily P&L matrix → live book.
https://t.co/VgNvaBnrsp
https://t.co/zMWH5woBle
0DTE Holy Grail checklist (steal this):
□ At least 2 engines (not 6 cousins of MEIC)
□ Entry times spread — not one hour owning the risk
□ Daily P&L correlation matrix reviewed (not “I diversified”)
□ At least one stream that loses on quiet days on purpose
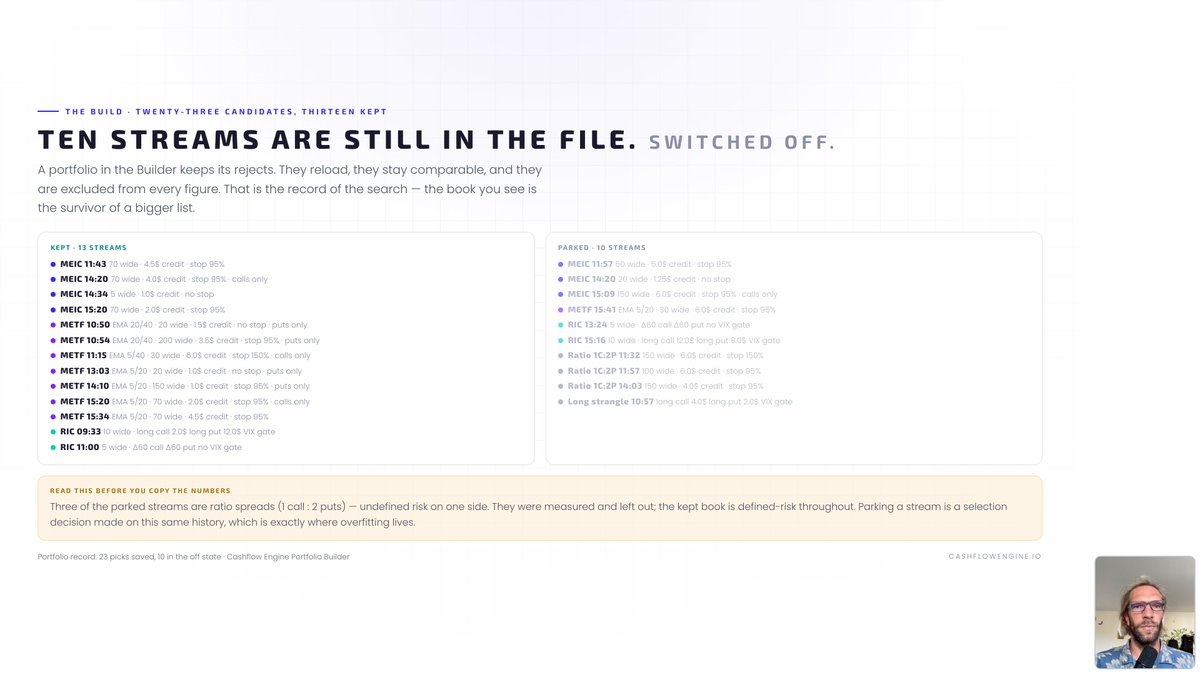
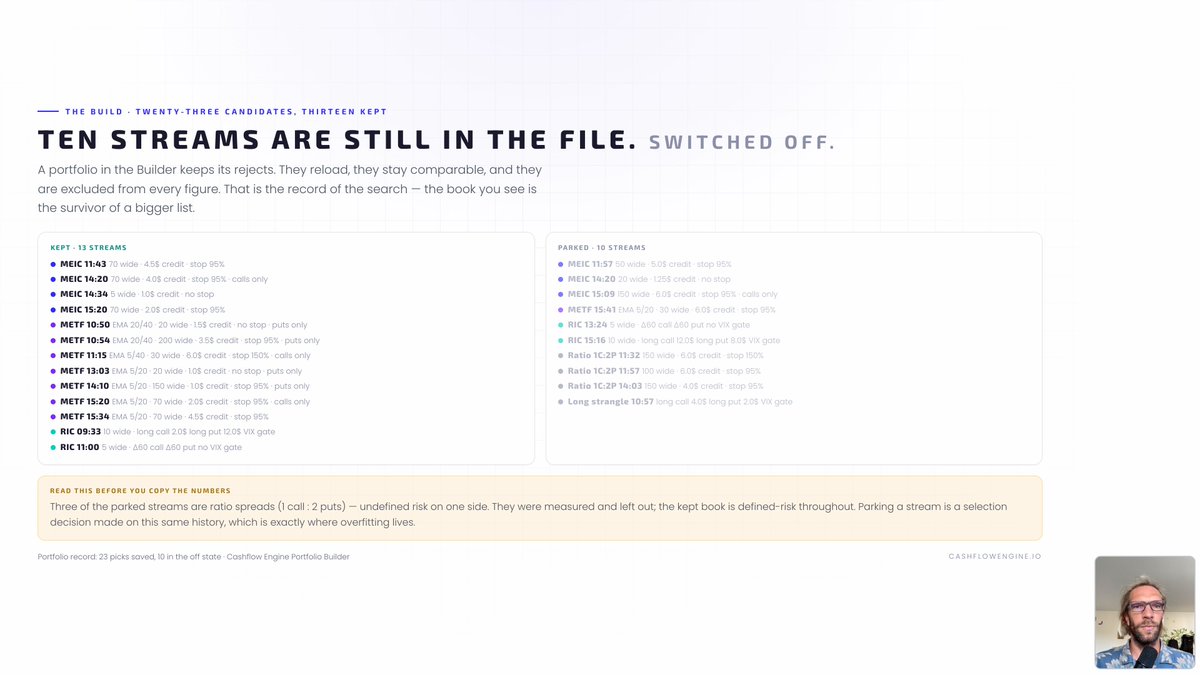
□ A kill list — what you refused to keep, and why
□ Live tape next to the backtest (FOMC days especially)
If you can’t show the matrix, you don’t have diversification.
You have a story.
Theory → live check.
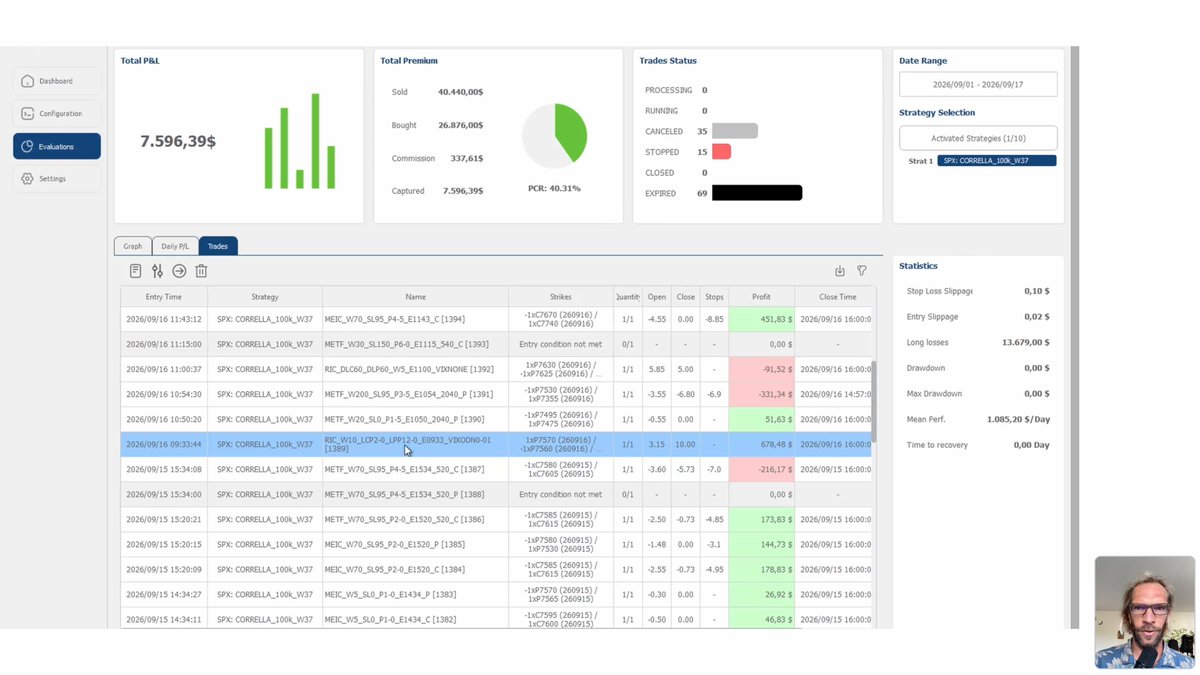
CORRELLA book, FOMC day Sep 16:
premium sellers printed red.
One reverse iron condor opened 9:33 made ~$700 of an ~$800 day.
Same thesis as the matrix: streams that disagree are the point.
We’re trading this book live and publishing week by week — losses included.
https://t.co/bB4XDQHDhV
Same history. Same 1-contract sizing. Hypothetical backtest.
1 stream (MEIC alone): ~16% CAGR · ~2.9% max DD · MAR ~5.5
+3 more MEIC: ~54% · ~2.3% · avg ρ ~0.12
+7 METF: ~128% · ~3.0% · avg ρ ~0.03
+2 RIC (long gamma): ~140% · ~1.7% · avg ρ ~0.01
Most people stop at step 3 (more return, still “related”).
Step 4 adds the quiet-day losers (win rates ~47% / ~25%).
Max DD almost halves. Peak buying power: about +$1k.
The lunch isn’t a better iron condor.
It’s the legs you’d cut if you only looked at win rate.
Portfolio construction is not picking winners.
In this book, four strategies carry ~⅔ of the risk.
Two carry less than nothing — their daily P&L runs against the book.
That’s the free lunch in practice:
you’re assembling streams that disagree, not stacking the highest MAR.
https://t.co/bB4XDQHDhV
This is the 0DTE version of Dalio’s bottom line.
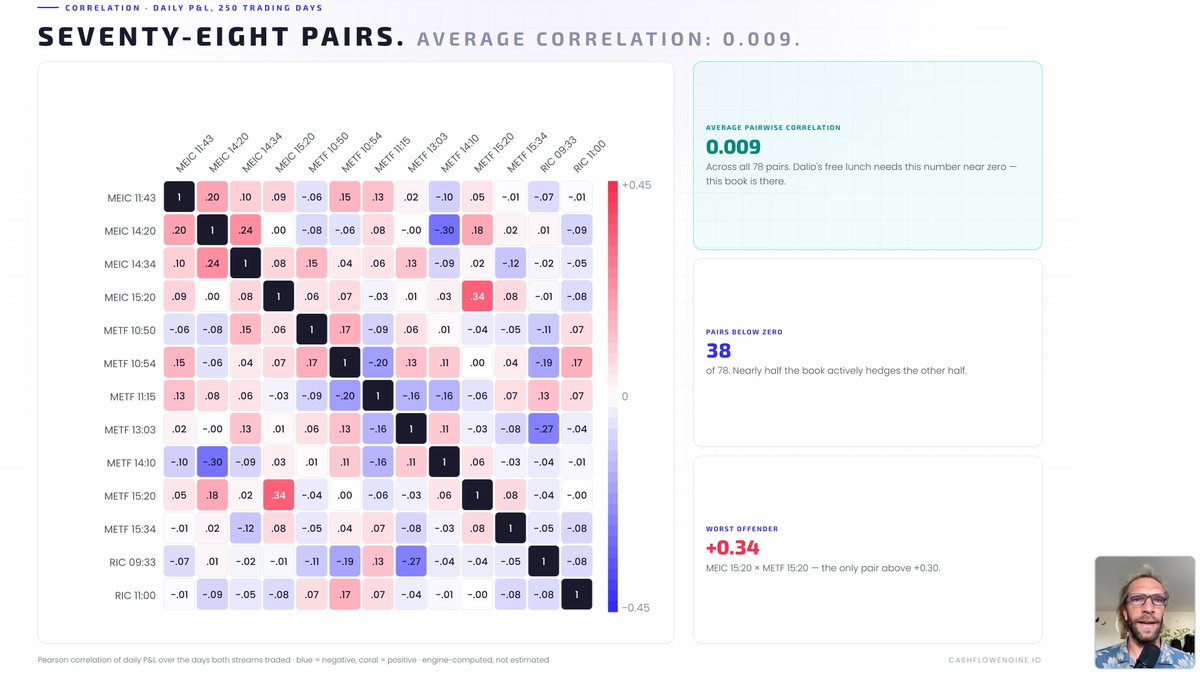
13 strategies → 78 pairs of daily P&L.
Average pairwise correlation ≈ 0.009.
38 of 78 pairs below zero.
Exactly one pair above +0.30 (same hour, same premium-selling risk).
Blue = hedges. Red = concentration.
I only know that because the matrix told me — not because the book “felt diversified.”
https://t.co/UvAWbx1Lmu
How to translate that chart into SPX 0DTE:
1) Stop counting “number of strategies.”
2) Count how they behave on the SAME day.
3) Measure pairwise correlation on daily P&L — not vibes.
4) Prefer different engines (premium / trend / long-gamma) and different hours.
5) Keep the legs that look ugly on win rate if they hedge the book.
If your six legs all sell premium into the same hour, you bought one stream six times.
Dalio’s Holy Grail in one picture:
Same expected return per stream.
Only correlation changes.
At ρ=0 the swing collapses as you add streams.
At ρ≈0.6 you barely buy anything after stream #3.
That’s Modern Portfolio Theory — not a Discord “setup.”
Most 0DTE books live on the top line without noticing.
I don’t want traders DIY-ing 200k backtests for exit folklore.
We already ran the research stack.
This series is the live layer: document the fills, not the vibes.
https://t.co/bu7X5xb9IN
Waiting for a better price can cost more than accepting a worse fill.
That’s the teaser I’m testing live — not a slogan.
Speed vs price control vs non-fill risk.
I’ll publish the ledger when it’s reconciled. Losses included.
EXIT-LAB-01:
One SPX 0DTE entry (14:03).
Seven concurrent exit policies.
Same book intent — different fill mechanics.
OptionsApp A–D + TradeSteward E–G.
Not seven opinions. Seven executable rules.
Full map in the video / Learn post.
No “best exit” crowned yet — Part 1 is the lab setup.
https://t.co/sH2OPvLZkc
Slippage isn’t “the market was mean.”
It’s the gap between the stop you configured
and the price that actually printed.
On 0DTE that gap can open in seconds.
I measured it the hard way — then designed EXIT-LAB-01 so I don’t have to guess next time.
May 18 cost me more than $20K on SPX 0DTE.
Not because the thesis was wrong.
Because the exit I thought I had wasn’t the fill I got.
So I stopped arguing opinions and set up a live experiment:
same entry · seven exit policies · real money · results later.
Part 1 (setup, not winners):
https://t.co/sH2OPvLZkc
Write-up:
https://t.co/HR40zzJMbK
Week 2 closed (week ending last weekend) — live books, W36:
Challenge $35K: +3.5% (+$1,237)
Challenge $100K: −0.8% (−$770)
W28 pick book: +$4,219
All other live books: +$10,758
All live together: +$15,444
(Prior week W35: −$6,627 · two-week total +$8,817)
Since Dec 1 realized: +$116,996
One green challenge book, one red. Both sat out Wednesday on TORQ — Wednesday was green. Skip still stands.
Walkthrough + the $100K rebuild:
https://t.co/ynXamC11h6