$TSLA (Tesla, Inc.) Daily Chart Update:
Closed at $391.37 (-1.53%) after briefly testing above the $400 psychological level (Intraday High: $404.40, Low: $385.83).
The broader uptrend remains intact following a strong V-shaped recovery from the recent sharp flush.
🟢 Key Support: ~$385.83
🔴 Key Resistance: $400 - $404.40
Healthy consolidation before the next breakout, or rejection at $400? Drop your thoughts below!
#TSLA #Tesla #StockMarket #TradingView #TechnicalAnalysis
• $MSFT demonstrated remarkable resilience today, with the daily candle showing a recovery from an intraday low to close slightly in the green. 👇
During pre-market and early trading, the stock faced downward pressure—dipping to $513.82—as a massive, multi-day global outage affecting Microsoft 365 services (including Outlook and Teams) persisted. However, buying interest surged quickly; the stock not only erased all its losses but also turned positive, closing at $523.99.
• 2/2
Why didn’t such a major outage trigger a sell-off in $MSFT? Two key factors stand out:
1️⃣ Strong relative performance: While the semiconductor sector and high-beta stocks saw broad declines today, Microsoft’s robust Azure cloud growth (+48%) and high switching costs have made it a "safe haven" for institutional investors.
2️⃣ Solid technical structure: The stock found immediate support upon pulling back to the $513–$514 range—a previous low—and remains firmly within a long-term upward channel.
Amidst this volatility in the tech sector, are large-cap cloud giants the most reliable defensive play? #MSFT #USStocks
$HOOD is down ~4.40% today to $77.88 (intraday low $76.61) after October metrics showed a sharp split: crypto trading volume plunged 48% YoY amid BTC weakness, prompting Goldman Sachs to trim its PT to $115. Meanwhile, event contracts surged 136% YoY to 5.9B. Watching the $76 support zone. #HOOD #Stocks
What is the market afraid of? Just look at the seasonal chart of the VIX (the "fear index").
🔵 This year’s VIX (thick blue line) is currently up 26.72%, with an extremely sharp, vertical spike visible on the far right. This perfectly aligns with the recent sell-off in high-flying tech stocks (such as NVDA).
In contrast, the low-volatility, "laid-back" market environment seen in 2023 (light blue line, -45%) is long gone; the current volatility landscape is more reminiscent of 2022 or 2024.
A sudden surge in the VIX typically signals that risk-aversion has reached a climax. For the bulls, this could represent a short-term "catharsis"—a release of pent-up pressure—but one must remain cautious: in a high-volatility environment, hedging against risk must become a top priority. #VIX #FearIndex #USStocks #MacroAnalysis
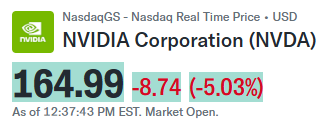
NVIDIA (NVDA) took a wild ride today! The stock hit an intraday high of 167.14 before plunging all the way down to 148.80—a staggering drop.
But take a look at the candlestick on the far right: a large bullish candle with a long lower shadow (closing at 164.30)—a classic "V-shaped" reversal! There was incredibly strong buying support near the 148.8 level.
Despite closing down 5.43% for the day, did you manage to hold on through this rollercoaster?
Corporate Governance Red Lines
Following reports of an affair with a direct report—on top of ties to an exec flagged by US intelligence—the board is moving to oust him. For institutional investors, fiduciary duty and compliance rules always outweigh founder legacy.
AMD is currently in a strong rebound phase following an extreme oversold condition. The latest large bullish candle has significantly bolstered investor confidence.
Short-term strategy: With strong momentum, the short-term outlook is bullish. However, given the substantial intraday volatility (522–567), chasing the price higher carries significant risk.
Key factors to watch: Monitor whether the stock can pull back in the coming days—testing the 522 support level without breaking below it—and subsequently break through the 570 resistance level on increased volume. A successful breakout would confirm a trend reversal; conversely, a failure to hold gains could lead to a period of wide-ranging consolidation. In terms of execution, maintain strict stop-loss discipline, with a defensive level set near 520.
Nvidia is currently in a rebound phase following a sharp decline.
The persistent, gradual slide encountered firm resistance near the 170 level, and the recent large bullish candle serves as a highly positive signal of short-term stabilization.
In terms of strategy, the focus in the near term should be on whether the stock can break through the resistance near 185 on sustained, high trading volume; meanwhile, the 170 level should be treated as a strict defensive floor.
Given the depth of the preceding decline, there is a significant volume of "trapped" investors (those holding positions at a loss) above the current price, which may lead to increased volatility during the rebound.
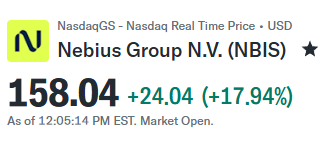
NBIS’s 17.57% gain today is driven by sector-wide beta—specifically a short squeeze—rather than an idiosyncratic "alpha" signal specific to the stock itself. CoreWeave’s better-than-expected earnings report and clear stance on future financing have temporarily neutralized the most pressing narrative surrounding the "new cloud" sector: the risk of a "funding cliff." As one of the stocks that had suffered the deepest declines and carried the heaviest short interest, NBIS naturally became a prime target for short covering.
However, the nature of this sharp rally is essentially a "pre-earnings positioning play." The real test will arrive before the market opens on November 12th: Can Q3 revenue meet or exceed the consensus estimate of $907 million? Will the Q4 guidance support the full-year revenue target of $3.0–$3.4 billion? And can management outline a financing path that does not rely on further, large-scale equity dilution? Until the actual earnings figures are released, the support level at $145–$150 and the resistance above $155 will serve as the key benchmarks for determining whether this rebound is merely a "one-day wonder" or the formation of a "cyclical bottom."
Micron’s current market situation is defined by an intense tug-of-war between exceptionally strong near-term cash flow and systemic skepticism regarding the sustainability of long-term earnings.
A forward P/E ratio hovering just above 4x, a valuation approaching tangible book value, HBM capacity fully sold out through 2027 at higher price points, and a $150 billion revenue foundation secured by 26 long-term agreements—these are all real, verifiable facts. Yet, the narrative of a "2028 earnings cliff," uncertainty surrounding order timelines due to geopolitical headwinds in the data center sector, and a clear technical downtrend have led investors to adopt a "wait-and-see" approach, despite the stock’s apparent "cheapness."
The core issue is not whether the fundamentals are solid, but rather what valuation multiple the market is willing to assign to the duration of this industry upcycle. Until the stock can reclaim the $750–$760 range on high volume, or subsequent earnings reports provide a clearer outlook on supply and demand dynamics for 2027–2028, the share price is likely to remain highly volatile as it continues to search for a bottom. From a long-term perspective, the current valuation offers a genuine margin of safety; however, from a trading perspective, being "cheap" within a downtrend is not, in itself, a buy signal—one must wait for confirmation through price action.
Intel’s current market situation represents a valuation reset driven by its forward-looking guidance. The better-than-expected Q3 revenue was completely overshadowed by a disastrous Q4 outlook; compounded by factory mishaps and an inconsistent foundry strategy, the market has been forced to shift its pricing anchor from a "transformation premium" back to the "reality of cash flow."
At the $57 level, a significant degree of pessimism is already priced in. Extreme oversold conditions suggest that the prerequisites for a technical rebound are beginning to take shape. However, a reversal of the medium-term trend requires at least one substantive signal: either no further downward revisions to the Q4 guidance, or a clear, verifiable path for the foundry strategy. Until then, the stock is likely to remain in a volatile, wide-ranging "bottom-fishing" phase. Any sustained rebound would need to be confirmed by trading volume and the filling of price gaps.
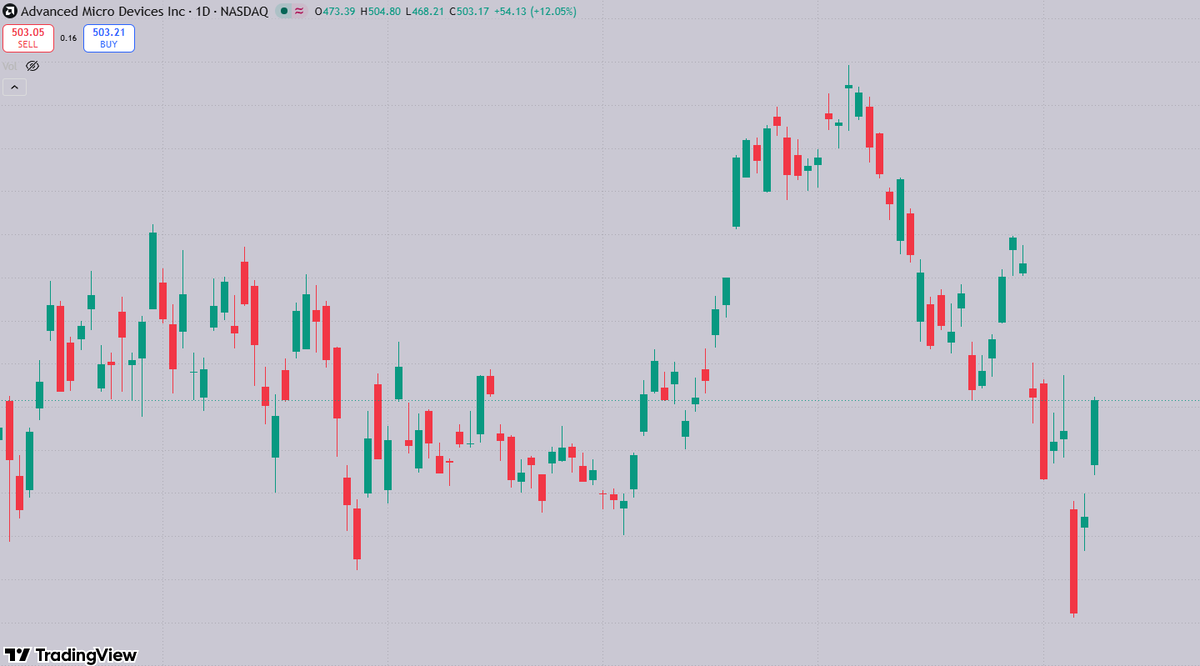
$AMD is experiencing **extreme, whipsaw volatility**.
After a brutal multi-day crash, the stock has staged a massive +12.05% V-shaped recovery, reclaiming the $500 level with authority.
While this massive bullish engulfing pattern signals immense buying power and a potential short-term bottom, the recent violent swings highlight a highly unstable market.
Bulls need to hold this momentum and defend the $470-$480 zone to confirm that this is a true reversal rather than just a dead-cat bounce.
$AMD is experiencing **extreme volatility**, characterized by a massive crash followed by a strong +8.15% relief rally.
While the green candle suggests buyers are aggressively defending the $400-$430 zone, the long upper wick shows that selling pressure remains heavy on rallies.
The stock is in a highly unstable environment; traders should expect violent swings as the market attempts to find a definitive bottom.
$AMD has suffered a catastrophic, high-impact breakdown, plummeting nearly 16% in a single session.
This price action completely invalidates the previous uptrend structure and signals a major shift to a bearish regime.
The stock is in freefall and has broken all near-term support. The technical picture is highly bearish; traders should be extremely cautious as the stock searches for a bottom, with the next major test likely being the summer lows.
The $VIX has experienced a massive volatility collapse, plummeting over 18% in a single session to erase the recent October panic spike. This is a highly bullish signal for the broader stock market (such as the S&P 500). The rapid drop back toward the 17 level suggests that the recent market fear was short-lived, and investors are quickly rotating back into risk assets. If the VIX continues to grind lower toward 15, it would signal a return to a complacent, low-volatility bull market environment.
$NFLX is showing a **strong short-term bullish reversal** after a multi-week pullback. The latest session's aggressive +4.68% bounce suggests that the recent selling pressure has exhausted, and buyers are stepping back in. While the broader trend from the August highs remains corrective, reclaiming this level is a positive signal. Holding above the recent $64 lows is crucial for the bulls to build momentum toward a retest of the recent highs.
$INTC recently suffered a **severe technical breakdown**, and the latest session shows only a weak attempt to stabilize near the $60 support level. The technical picture remains highly fragile. Holding $60 is crucial; if this psychological floor gives way, the stock could rapidly retest its summer lows near $50. The chart remains highly bearish until a clear reversal pattern forms or the overhead gap is filled.
$TSM is in a **short-term downtrend**, having retraced significantly from its mid-October highs.
The latest session shows a bearish close (-1.85%), breaking below the key $400 support level. The "Overnight" marker suggests further weakness ahead.
The technical picture is turning bearish in the near term; the next major support zone to watch is around the $380–$385 area.
$KDP is in a strong, established uptrend, having successfully broken out of its multi-month consolidation range.
The latest session shows a bullish continuation (+2.73%), and the "Post" label indicates even stronger after-hours momentum.
The overall technical picture is highly bullish; the stock is trending upwards with no immediate signs of resistance, making pullbacks likely to be bought.