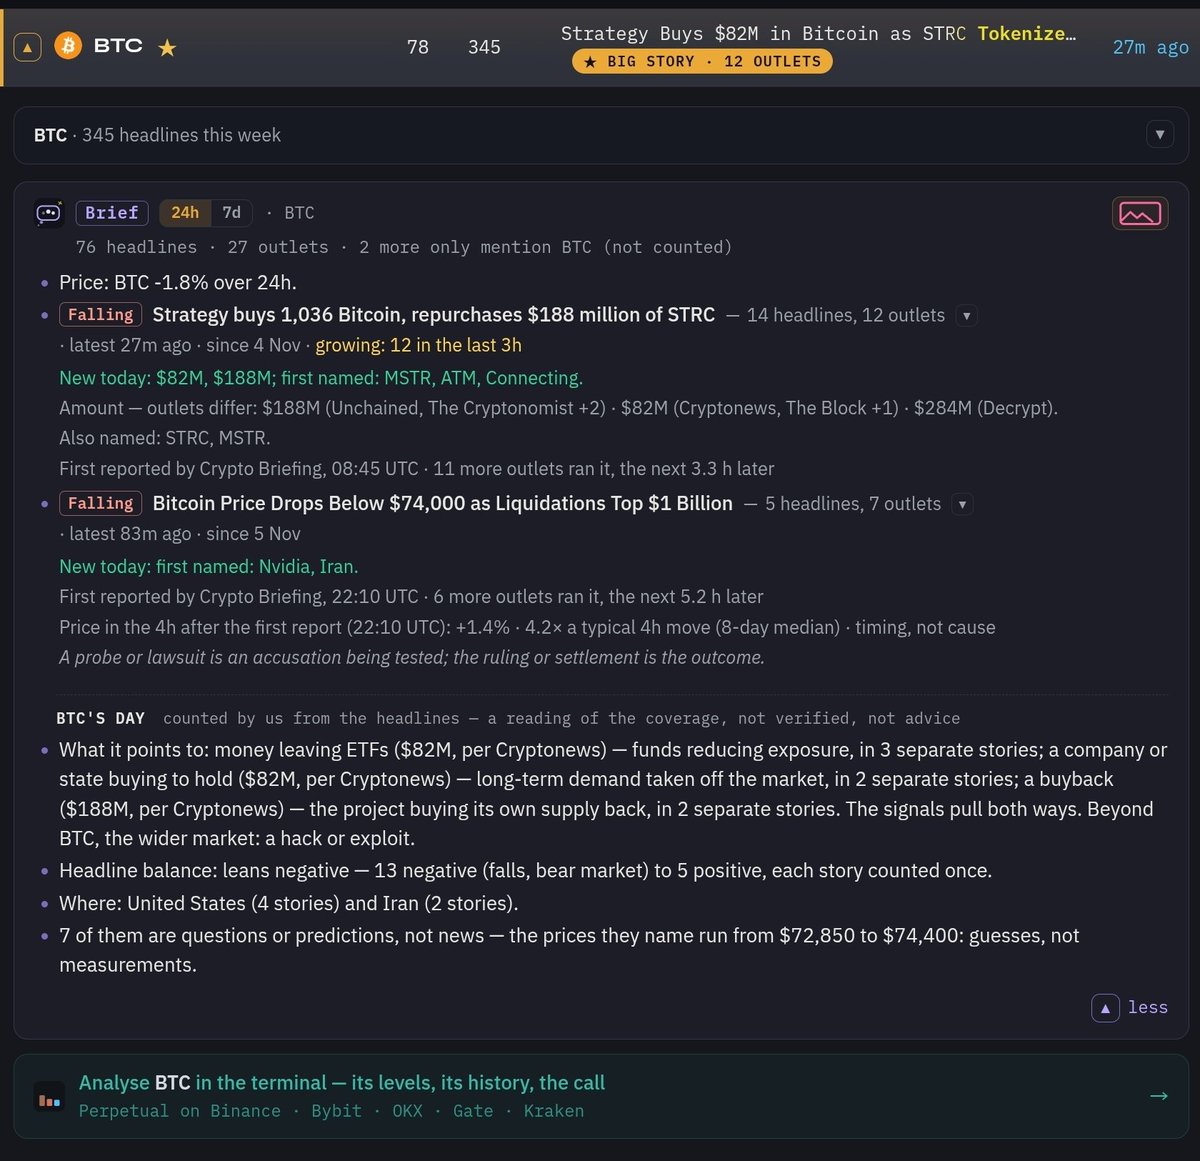
🚨 BIG STORY: Strategy just bought 1,036 BTC (~$82M) + $188M $STRC buyback → now holds 850,364 BTC.
While most people scroll past noise, this is the exact kind of multi-outlet move that actually moves markets.
Never miss the next one.
AI brief on every major event, coin by coin, from 100+ sources: https://t.co/7m5M0Umpu1
#Bitcoin #BTC #MSTR #Strategy #CryptoNews #Saylor
Tomorrow: US October CPI (Tue 10 Nov, 8:30 AM ET).
A hotter-than-expected print typically delays rate cuts further and has historically driven the sharpest crypto moves in the hour following the release.
The Watch calendar on ChartPatternLab offers clear, high-impact event tracking with relevant headlines and market context in one place — a precise way to stay ahead of key macro catalysts.
https://t.co/gcidqXdtLJ
#CPI #Crypto #Bitcoin #Inflation #Fed #Macro #ChartPatternLab
Never miss an important market event.
ChartPatternLab's AI-powered event calendar keeps track of what's coming up — from US CPI and jobs reports to exchange launches, regulatory deadlines and major industry events.
Updated once a day, so you know what's ahead and when it matters.
Stay prepared. Stay informed.
https://t.co/gcidqXdtLJ
#ChartPatternLab #Crypto #AI #MarketNews #EconomicCalendar #CryptoTrading
The level of data engineering on ChartPatternLab is next level.
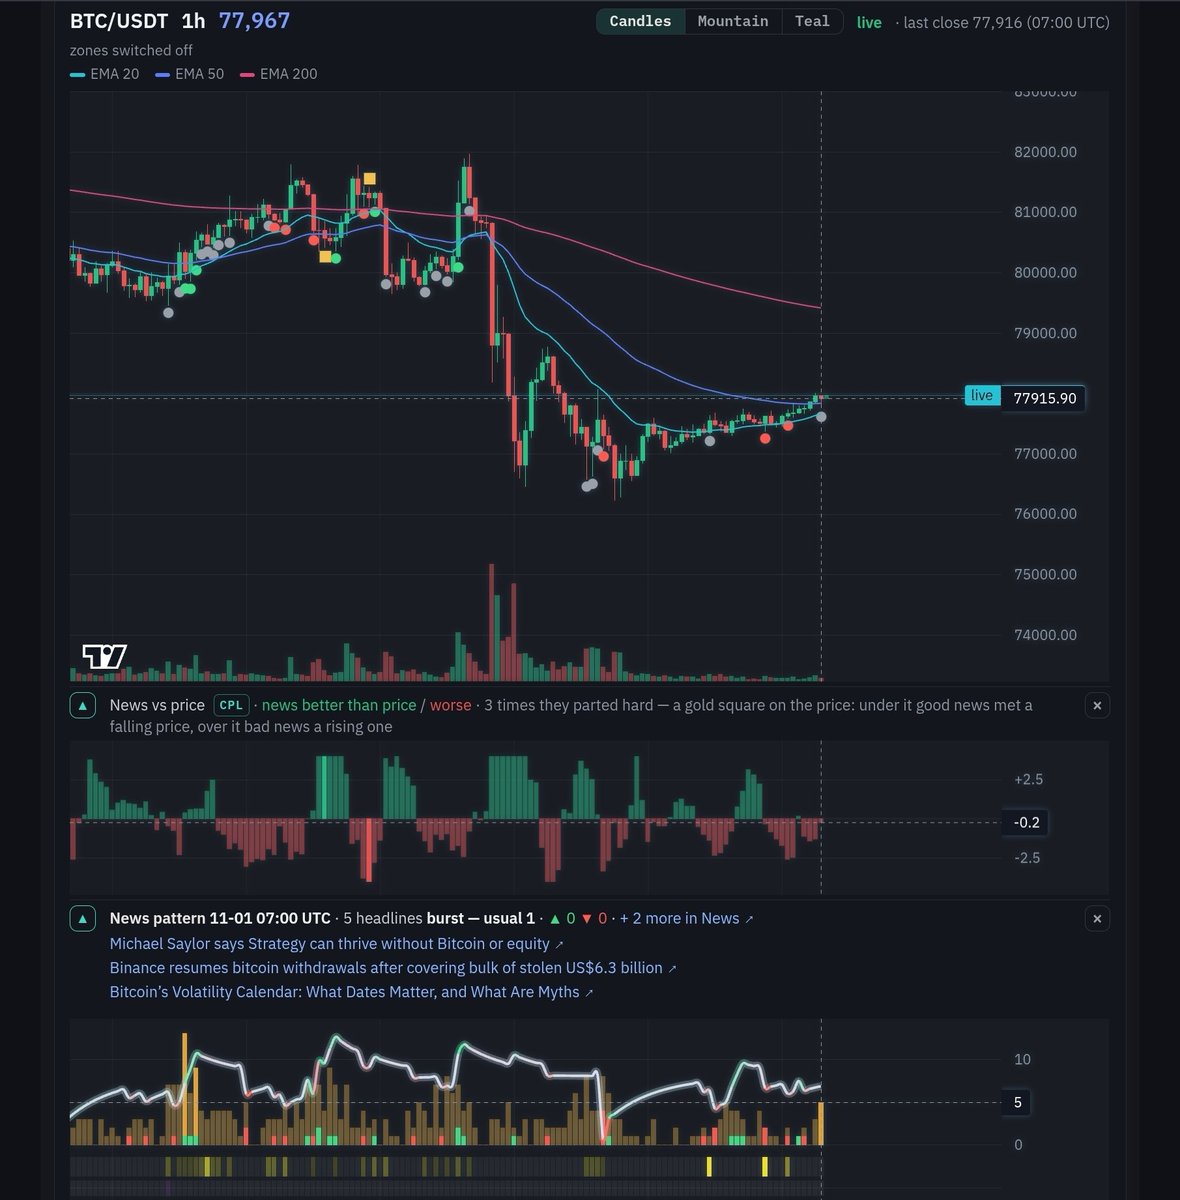
Instead of lagging price derivatives, we map actual alternative data directly onto the timeline. You can literally tap any candle/bar to audit the exact news burst behind that specific hour's volatility.
Look at this: price stabilizes at $77.9k right as the interactive 'News Pattern' indicator reveals a 5-headline burst (vs the usual 1), breaking the massive news of Binance resuming BTC withdrawals after covering the $6.3B exploit. No more guessing why the order book is shifting.
Pure data, zero hindsight bias.
Check out the terminal here: https://t.co/jkhEYr8MTF
#CryptoTrading #Bitcoin #DataAnalytics #Orderflow #TechnicalAnalysis #BTC #ChartPatternLab
The level of data engineering on ChartPatternLab is next level.
Instead of lagging price derivatives, we map actual alternative data directly onto the timeline. You can literally tap any candle/bar to audit the exact news burst behind that specific hour's volatility.
Look at this: price stabilizes at $77.9k right as the interactive 'News Pattern' indicator reveals a 5-headline burst (vs the usual 1), breaking the massive news of Binance resuming BTC withdrawals after covering the $6.3B exploit. No more guessing why the order book is shifting.
Pure data, zero hindsight bias.
Check out the terminal here: https://t.co/jkhEYr8MTF
#CryptoTrading #Bitcoin #DataAnalytics #Orderflow #TechnicalAnalysis #BTC #ChartPatternLab
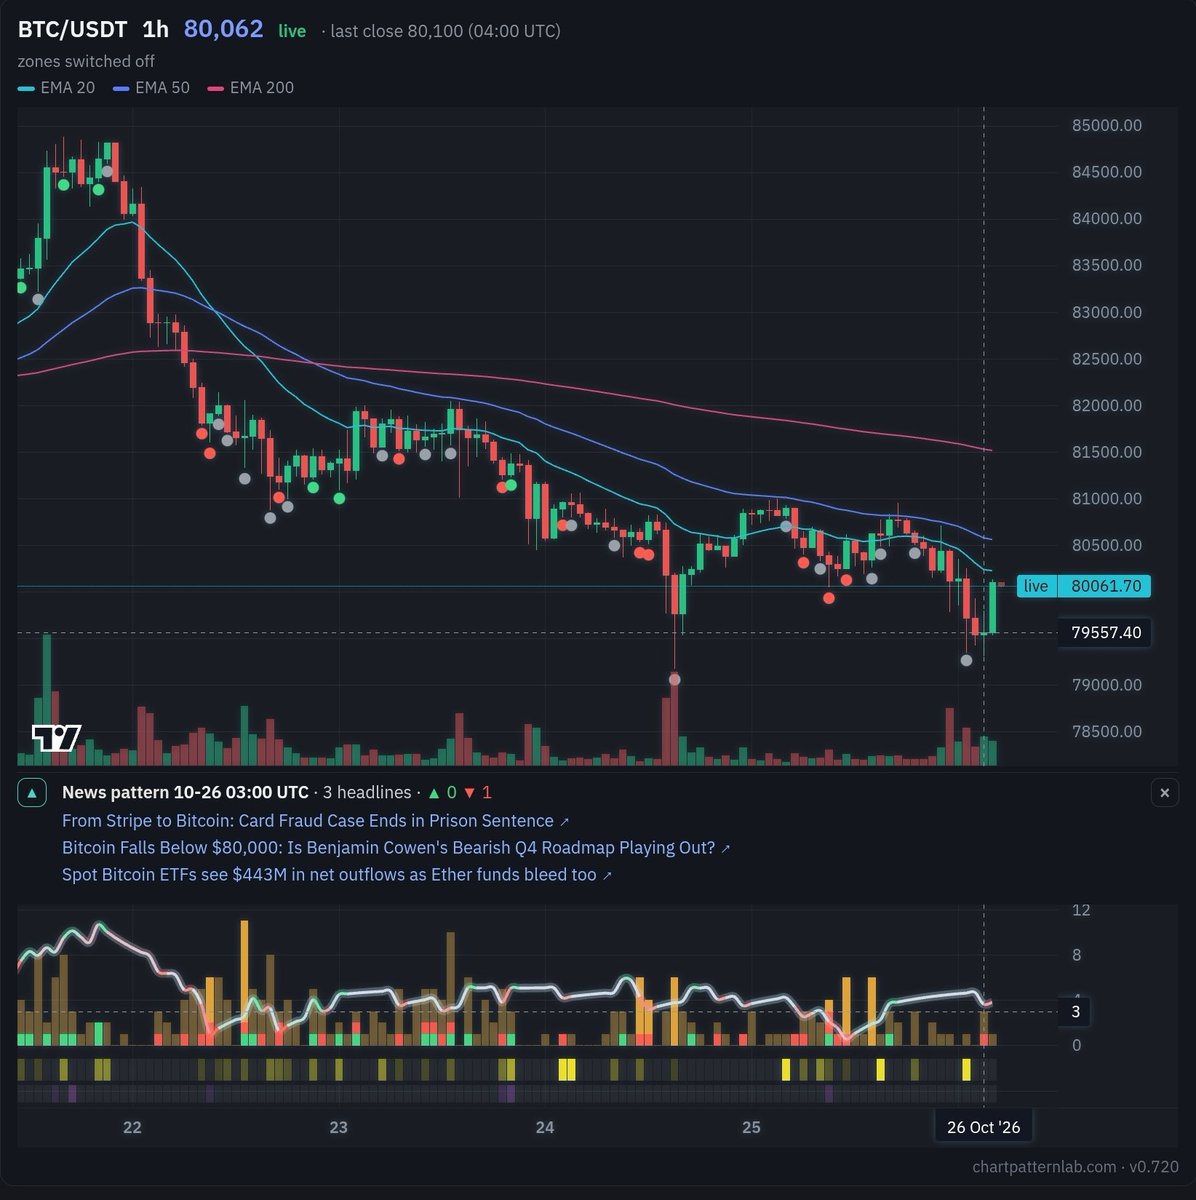
It’s 3 AM. BTC just dumped $2,000 in a single hour. You stare at the red candles, wondering what the hell just happened.
By the time you find the news—an ETF outflow or a macro headline—the move is already over.
Most tools force you to choose: you can have a technical chart OR a news feed, but never both. Technical analysis without context is blind, and news without price action is just noise.
That’s why we built the News Pattern indicator in the ChartPatternLab VIP Terminal.
We map breaking headlines, sentiment, and catalysts directly onto the exact timestamp they hit the wire. You can literally trace a price drop straight down to the story that caused it.
Free shows you the chart. VIP shows you what it means.
No ads. No hype. Just the technicals, the narrative, and the receipts.
Start your free trial and see the market clearly: https://t.co/jkhEYr8MTF
#Bitcoin #BTC #CryptoTwitter #TradingTools #Fintech #MarketResearch
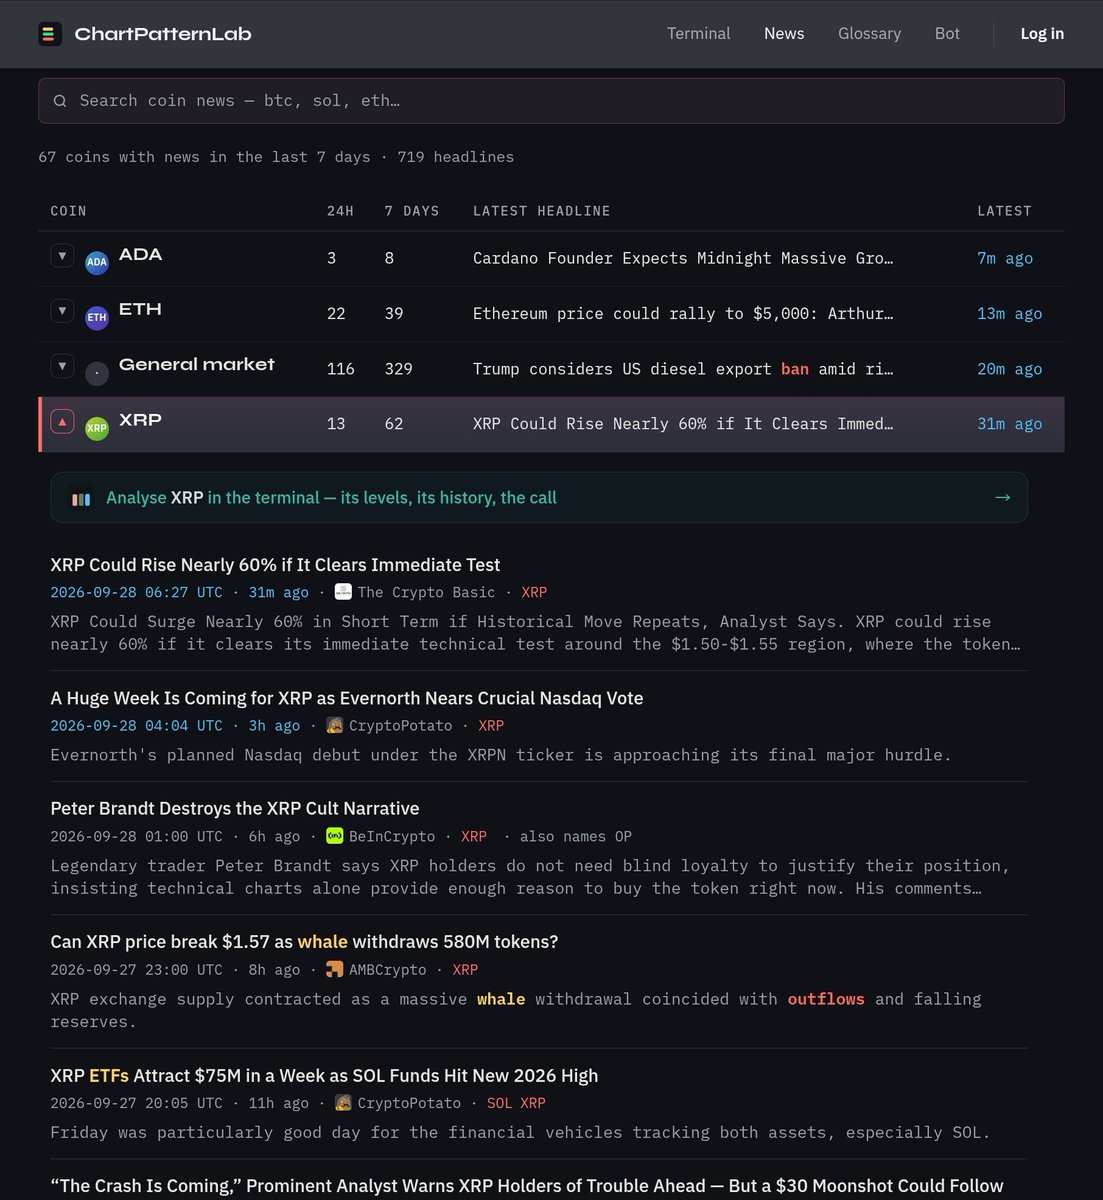
Tired of refreshing 15 different crypto sites just to stay updated?
There’s a better way. One feed that pulls recent headlines from outlets worldwide into a single place — sorted by coin, tagged by topic, and updated constantly.
No more tab chaos. No more missing the big story because it was on a site you forgot to check.
This is how to actually stay on top of the market now.
#crypto #btc #bnb #ada #xrp #markets #sol #xmr
Most crypto news bots just scream "BREAKING!"
Most signal bots just scream "BUY!"ChartPatternLab has 3 unfair advantages:
1️⃣ "Timing, not cause" — We measure the 4h price reaction to news. If the market didn't care, we tell you.
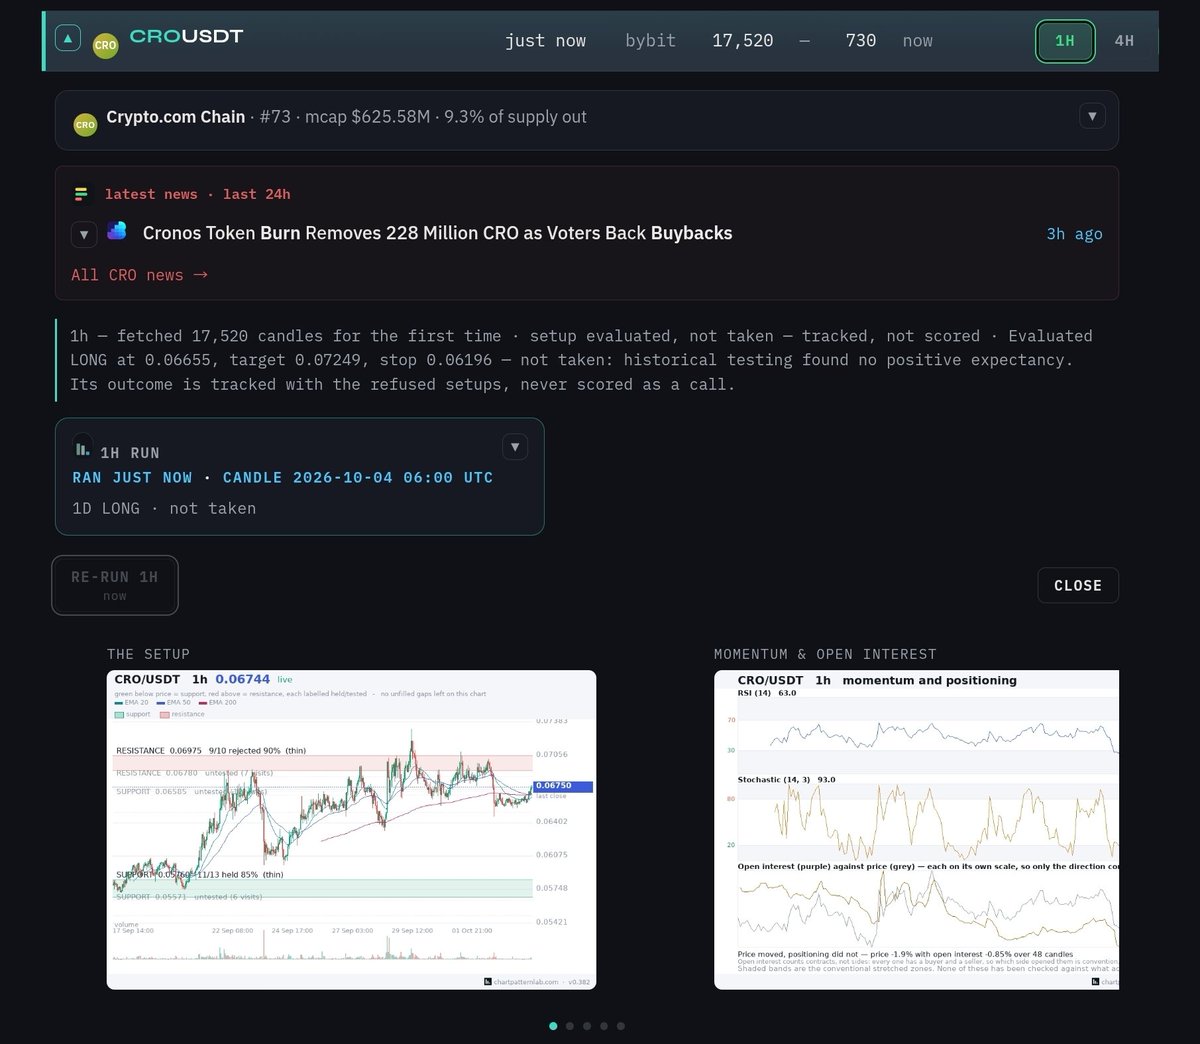
2️⃣ "Refused" setups — We test patterns out-of-sample. If the math fails, we refuse the trade.
3️⃣ Deterministic logic — No AI hallucinations. Just cold, hard, rule-based data.
Stop gambling. Start trading with an edge.
👉 https://t.co/7m5M0Umpu1
#CryptoTrading #Quant #Bitcoin #AlgorithmicTrading #TradingBot #DataScience #Web3
Most crypto news feeds just dump 100 headlines on you and call it a day.
We built a Brief that tells you who broke the story first, how long it took other outlets to copy it, and what the price actually did in the 4 hours after.
Tagged by Coin, Person, Region, and Sector. No hype. Just receipts. 📉
https://t.co/PLE8KXWoR6
#Crypto #Bitcoin #CryptoNews #Fintech #TradingTools
@FXOwlHarmonic Agreed — the reaction around $81.7K–$82K looks key now. If that support fails, would you look toward $80.4K next, or wait for a retest before confirming continuation?
Clear rejection at the ~84,300–84,400 resistance cluster that had held multiple times.
Breakdown below the recent range and the short-term EMAs, with the live price now well under the 20/50 area.
Volume expanded on the selloff candle, consistent with liquidation or stop-driven selling.
Near-term support is being tested in the low $81,700–$82,000 zone (visible on the second chart and matching today’s lows). A sustained break lower would open the door toward the prior swing lows around $80,400–$81,000 from earlier this week. Holding here could allow a bounce back toward the mid-$82ks or the broken EMA cluster.
Crypto analysis is easy to publish. Harder to verify.
ChartPatternLab puts the data on the record.
📰 Instant news for your coins, with actual price reactions.
📊 Analysis with price levels and historical sample sizes.
🎯 Every call recorded, including wins and losses.
No “liquidity grab” storytelling. No hiding the track record. Just data, analysis, and outcomes.
Explore it free → https://t.co/7m5M0Umpu1
#Bitcoin #BTC #Crypto #Trading #TechnicalAnalysis #CryptoNews
🟢 UPTОBER SALE IS LIVE.
Charts are green. The VIP price just followed. 📈
Get full ChartPatternLab access:
⚡ Monthly — $12
🔥 Yearly — $120
💎 Lifetime — $260
Full readings. Entry, targets & stops. Support/resistance with historical records. Momentum, positioning, evidence, weighting & every chart when available.
Up to minutes news context included.
No more searching across the net.
One place. One terminal.
One engine. Real data. Every call recorded.
Uptober prices until Oct 31 🎃
https://t.co/gcidqXdtLJ
#Bitcoin #Crypto #Trading #BTC #Altcoins #CryptoTrading #TechnicalAnalysis
Crypto research shouldn't mean jumping between 10 different sites.
Search a coin on ChartPatternLab and get the latest news right next to the market analysis — price structure, momentum, volume, open interest, funding, historical context and tested levels.
One coin. One screen. The news + the numbers behind the move.
And if the data isn't strong enough to support a call, it says so.
https://t.co/gcidqXdtLJ
#Crypto #Bitcoin #Altcoins #CryptoNews #TechnicalAnalysis #Trading #shib
New on ChartPatternLab 📰
Crypto news without the endless scrolling.
Search news by coin — BTC, ETH, SOL or anything else you’re watching.
And it doesn’t stop at news 👀
Any coin can be analysed directly on ChartPatternLab.
News → data → analysis.
https://t.co/5Fy54i0zDR
#Crypto #Bitcoin #Altcoins #CryptoNews #Trading #TechnicalAnalysis #BTC #ETH #SOL
🚀 ChartPatternLab update
The platform has had a major rebuild under the hood.
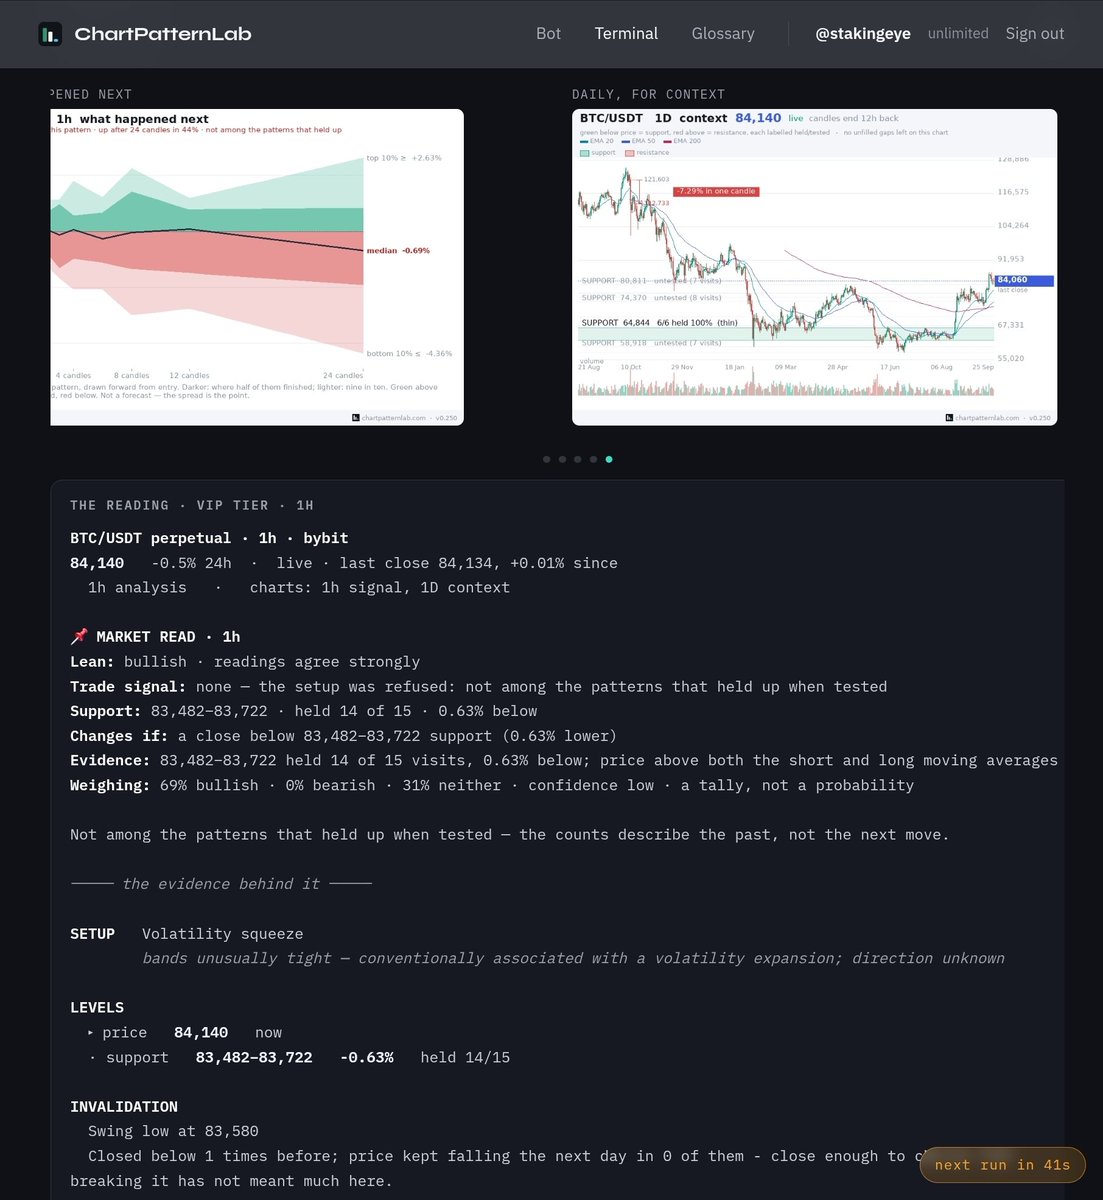
Reports are now cleaner and much more explicit about the difference between what the market looks like and what the data actually supports.
• Market Read — current conditions in plain English
• Historical sample sizes & measured outcomes
• Tested support/resistance records
• Funding, OI, volume & positioning context
• Out-of-sample validation
• Mechanical trade rules separated from descriptive readings
• Every qualifying call recorded and tracked
• Weak or unvalidated evidence = NO SIGNAL
A chart can look 100% bullish and still produce no trade.
A direction is not a signal.
Bot + Terminal → https://t.co/jkhEYr8MTF
#Crypto #CryptoTrading #TradingTools #TechnicalAnalysis #Bitcoin #Altcoins