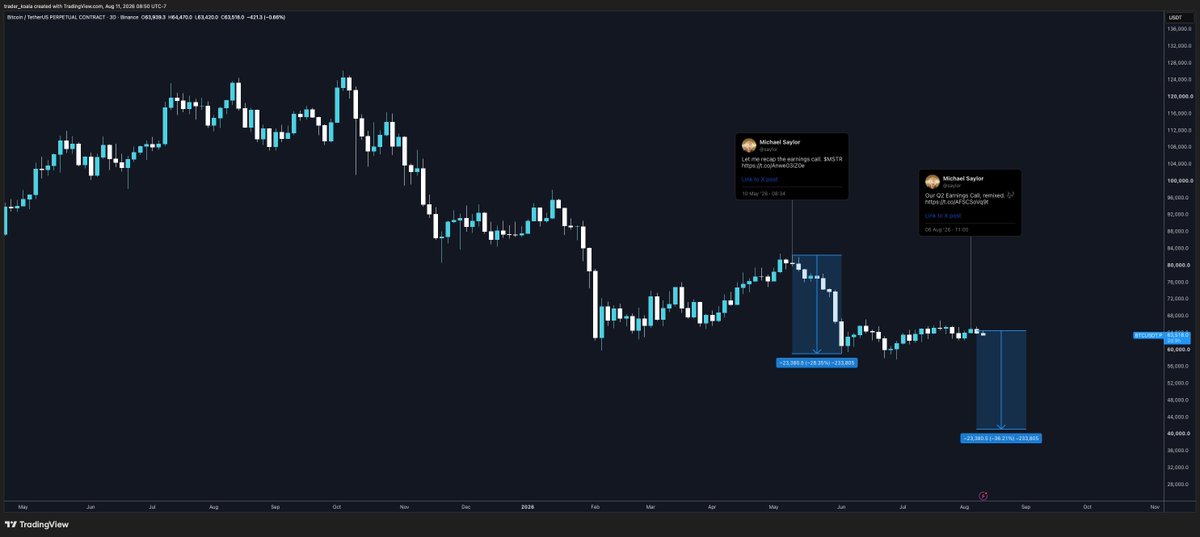
I think this is going to be ignored and many people are going to get crushed in high leveraged $BTC longs here.
Too much euphoria considering market structure hasn’t changed.
+ I want to keep buying low so I welcome this!
I called this $BTC rally from the start but I’m starting to believe it’s going to retrace & possibly form our new lows.
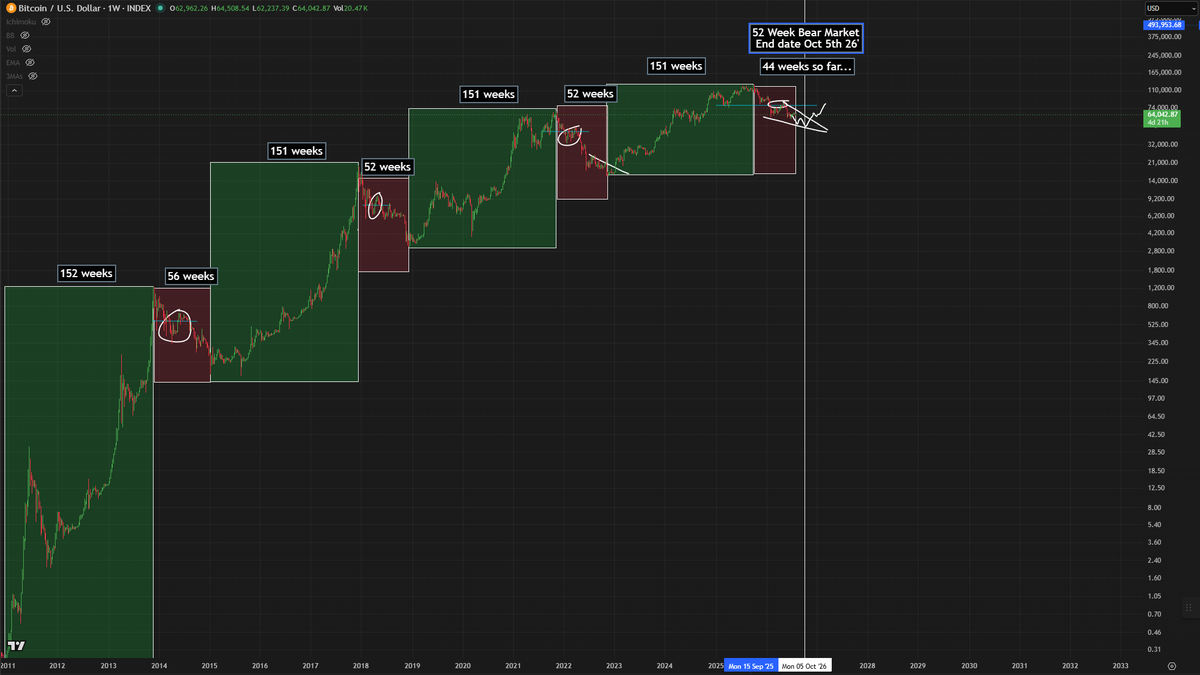
There’s WAY too much euphoria on the timeline + we technically have 6-10 more weeks of bear market according to history.
Trap city. Take profits.
$BTC 1D
Absolute text book bullish move here. Double bottom reversal with bull divs, momentum, & price action. High volume on the breakout of 65 & 67k.
75k is the next area of resistance we need to break to go higher - i wouldn't expect much of a pullback until then!
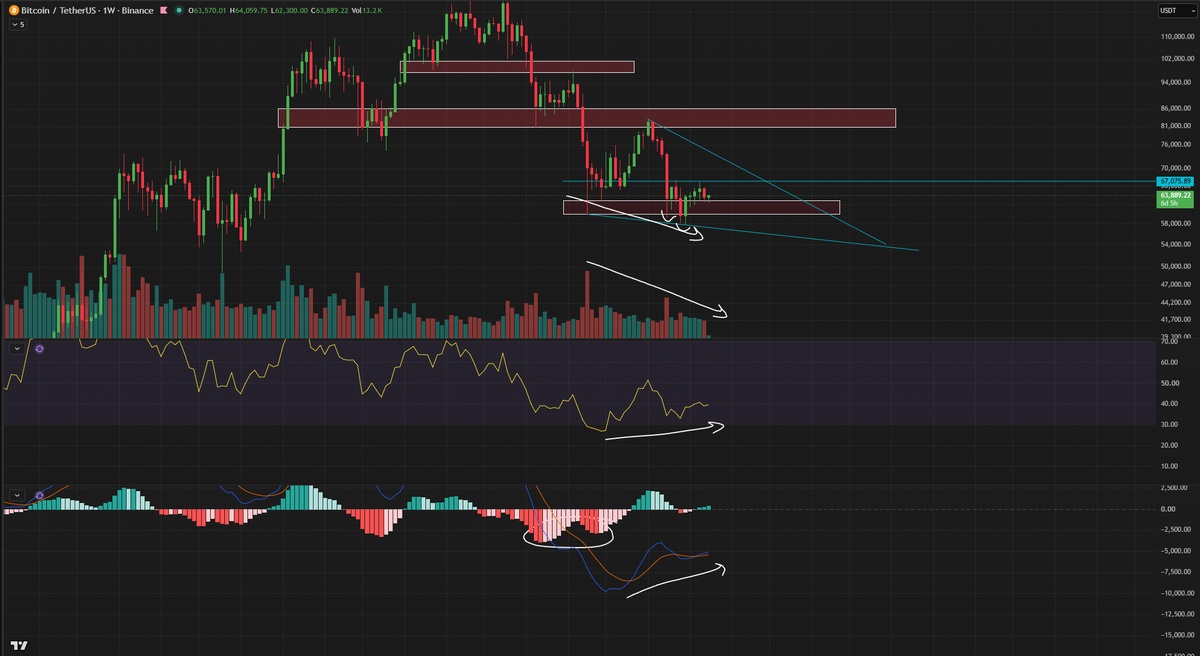
As much as I want the $BTC bottom to be in, there is something to note here.
We have low volume + price pumping on 1W with potential bear divs forming.
This doesn't mean the bottom isn't in - it means we have the potential to put in one last low before the bottom is in.
@Deficryptosanti@DrProfitCrypto Traders do not have crystal balls but great traders will update predictions as the chart updates itself. New Chart equals New Information. Ego will hold onto Old predictions, even if it hurts themselves and others. But great traders update their thoughts along the way.
@Deficryptosanti@DrProfitCrypto As long as he changed his mind before predicted Target was reached, and thereby protected himself and his followers then changing mind at those correct moments, is the sign of great trader. If he changed his mind after others were destroyed, then criticisms might be valid.
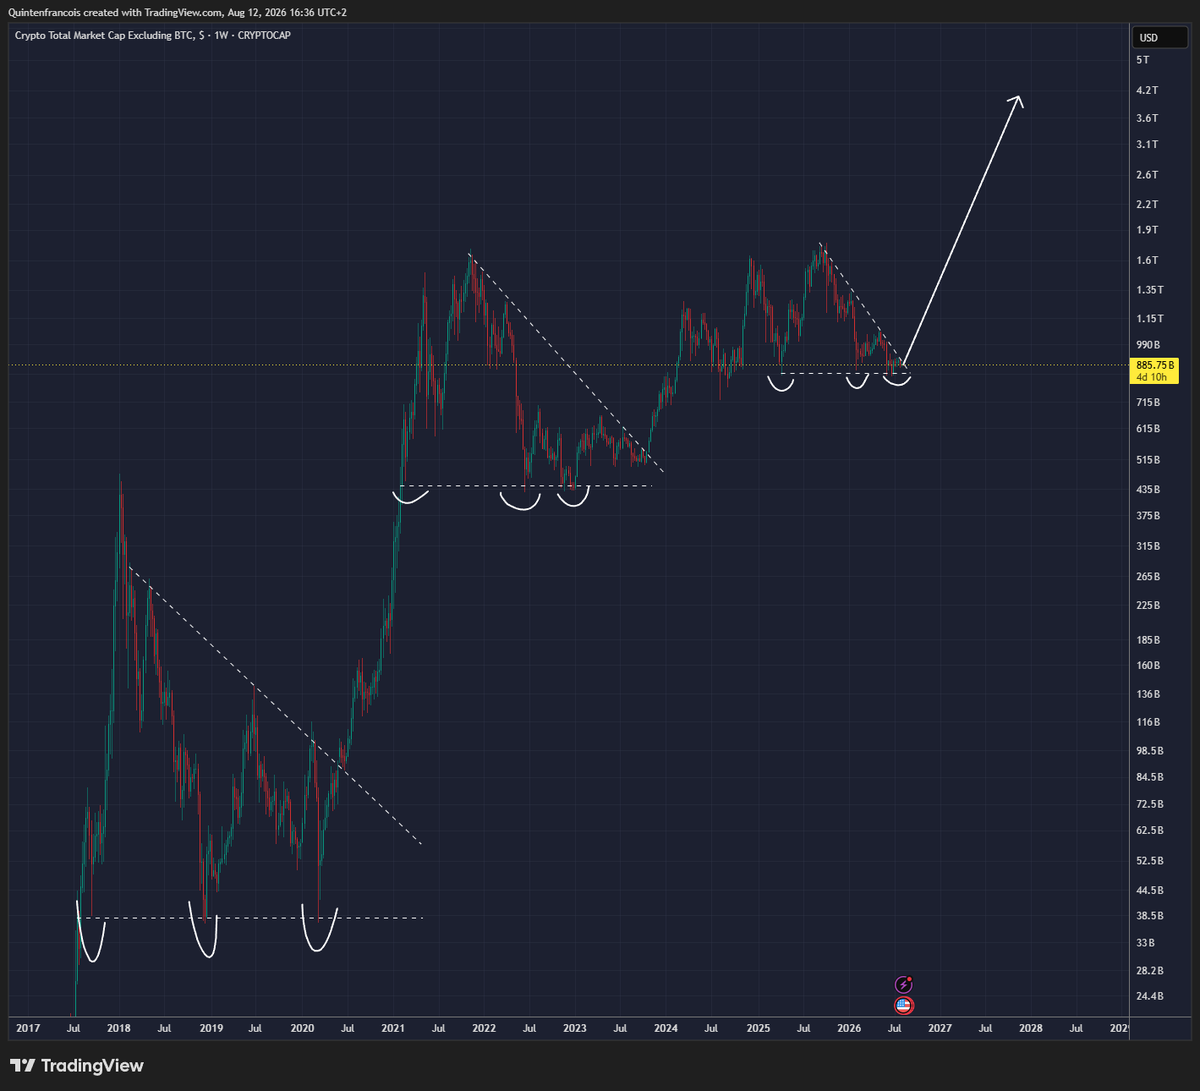
There are MANY #Altcoins that are:
-Flat against BTC since Q4 2025/Q1 2026
-Creating Bullish Divergence on HTF against BOTH USD & BTC
-Look like the Wall Street "Cheat Sheet" bottom against BTC
-In huge falling wedges against USD
Maximum Opportunity
Example #Fartcoin :
I can't ignore this chart from 2 months ago:
It does really look like we still have to get the third hit (low retest) in the bigger picture.
Looks like the 2 consecutive hits we got in a short period of time were both part of the deviation hit. Big range.
Comparing the current #BTC price action to mid-2014, 2018, 2022 prior to the final drop does not align here with any of the indicators
The final drop took place back in February with a slight sweep at the end of June
Dozens of indicators are confluent with it
Could there be one more sweep after having already swept the lows in June? possible
Has there ever been two sweeps of the lows in BTC history? No
Regardless if it sweeps or not these prices will either be the low or within a small percent off from the low hence why I have bought
The biggest issue for the #BTC bears excepting a crash into October is that with the S&P500 breaking out higher and BTC-S&P500 pair showing a potential bottom the the math just does not work out favorably whatsoever
Early October is now 7 weeks away
Over the past four years when the S&P500 has broken out its rally has lasted anywhere between 7 to 29 weeks
But even if the S&P500 rally only lasts 7 weeks, even on a pullback it has not gone below where the rally started for at least 12 weeks
The Bears now need something to take place that has not happened in the past 4 years, which is for the S&P500 to roll back over after breaking out
Also even IF BTC-S&P500 has not bottomed and were to pullback say 5% below the low (many bottom signals already flashing), a 5% move up on the S&P500 would offset a 5% move down on BTC-S&P500
A lot of the bearish angles were heavily relying on the S&P500 to roll over out of its consolidation because of the belief of it being a mid-term year but instead it has broken out as this is more in line with the Macro-Risk Bull Market which over the past 30 years have not been in line with a mid term year
Stocks are heading much higher over the coming years
I have been bullish on Stocks since Q1 2023 and remain bullish on stocks as this is likely just the start of the next Macro-Risk Bull run for the first times since 2003, 2009, 2012, 2016, & 2020 (not a single mid-term year)
Max Opportunity right now
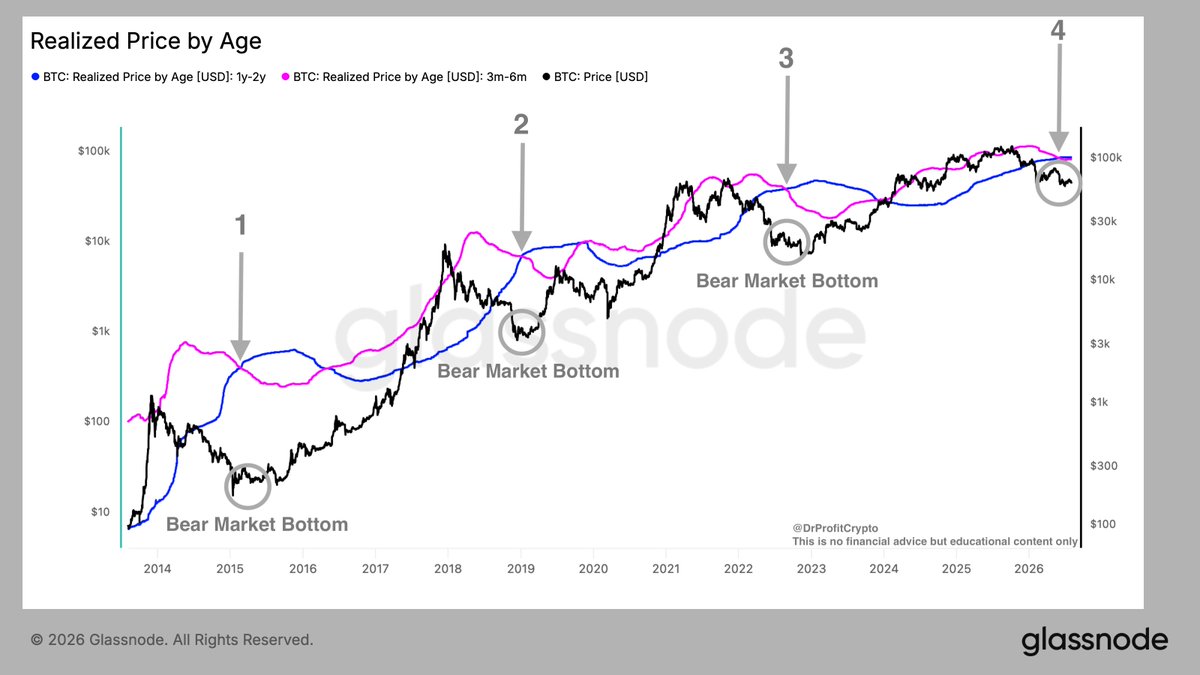
$BTC: Historic Indicator flashing bottom was in or is very close
Realized Price by Age shows the average price at which different groups of Bitcoin last moved on-chain, giving us an estimate of their cost basis. The pink line represents Bitcoin held for 3–6 months, while the blue line represents BTC held for 1–2 years.
In 2015, 2019 and 2022, the bottom-formation phase began when the pink line crossed below the blue line. This shows that newer buyers capitulated, sold at a loss and transferred their Bitcoin into stronger, longer-term hands. We are now seeing this crossover for the fourth time, while Bitcoin is trading below both groups’ average cost basis. Historically, however, this did not produce an immediate reversal, as Bitcoin continued moving sideways for months while the market formed its base which can be translated into an accumulation zone, what I spoke about in the last Sunday Reports. This is exactly what I believe we are witnessing now: a bear-market bottom formation and long-term accumulation phase. I am buying step by step between 54-64k since weeks already, and I am sharing each of my buy orders in 5% steps in real time in the premium membership only. Join now: https://t.co/Qx4dZU3sVM
This is Educational content, not financial advice.
This is my argument for why there was no euphoric top and no over-extension. It is the reason crypto has been getting crushed for years, but it is also why that environment is coming to an end very soon.
If we observe the first three Bitcoin cycles on the chart, tracking the four-year cycle in orange and the business cycle in blue, a clear pattern emerges. When these are moving in the same direction, specifically when they are both expanding, Bitcoin's most parabolic phases occur. There are no exceptions.
Both cycles are real, and when the two forces align, the amplitude increases, much like waves in the sea combining to form a massive swell. This is constructive interference, and we grew used to that.
Since 2023, these cycles have been fundamentally out of sync. I call this cycle dissonance. Not only were they out of sync, but the business cycle has been practically non-existent. The result? A Bitcoin cycle that was lacklustre, leaving the majority of the broader market unable to recover.
But the dynamic is about to change. Soon, the four-year cycle will start over, and the business cycle is already positioned to meet it. Constructive interference returns, bringing that massive swell. For how long is anyone's guess, and I believe it does not matter anyway. What matters is the impulse in the medium to long term, once this current bottom resolves.
$BTC 1W
All of our reversal signs still remain:
- Bull divs RSI, loss of bear momentum, Bearish PA exhaustion, 1M RSI hitting sub 40, 1M MACD Reset, !HS reversal setup 1D, 44 weeks into our 52 week bear market.
The bear market is towards its end not beginning.
$BTC is currently 44 weeks into its typical 52 week bear market.
At 52 +/- a few weeks we generally see the bottom. This means you're running out of time to buy at a discount.
This has been on point with every single cycle since it's creation. This time won't be different.
@ContrarianEXTRA Countries and humans trust of one another is devolving. We are in a global Ponzi scheme from printed money. When trust and money collapse, then technology gets interrupted. What is the distance between a peak society and a Dark Age?