Bullish scenario (preferred): Look for a pullback into 4,170–4,175 followed by bullish confirmation. If price breaks and holds above 4,185, momentum could accelerate toward 4,205, then 4,240, and potentially 4,270
Buy it before July 9th.
Current price: 45.1 US dollars
Target price: 754 US dollars
The company is building a next-generation artificial intelligence semiconductor intermediator to power NVIDIA and IBM high-performance computing systems.
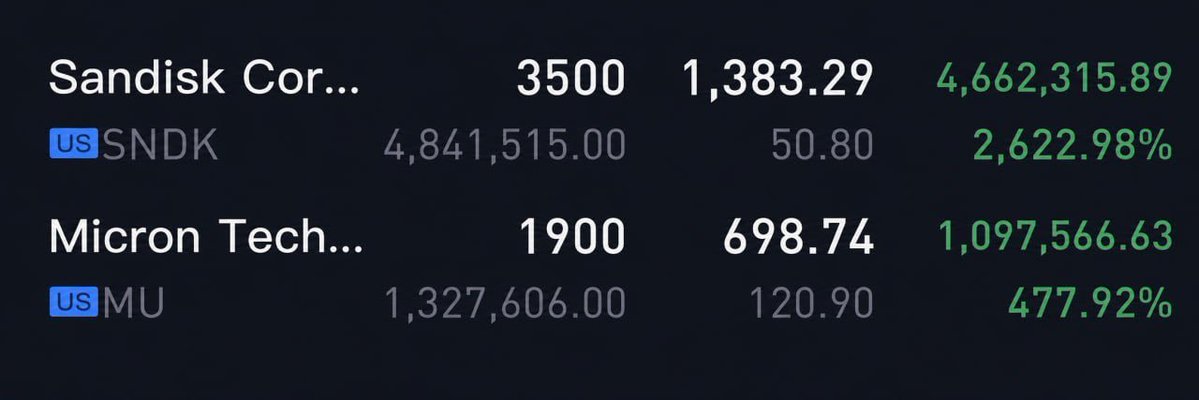
4 months ago: SanDisk went from $50.80 to $1383.29. Micron went from $120.90 to $698.74. I talked about them many times, but most people ignored it. Now, I’m watching another name with a similar setup. This time, I’ll only say it once.
The year is already half over.
Most stocks and crypto have struggled this year.
That's why investors who were positioned in some of the biggest winners like AMD and Micron have done very well, while many others have struggled.
I'll be honest, many of my investments haven't done very well this year.
But because I've had such a large AMD position, I've still outperformed the market and made some nice gains overall.
How have your investments performed this year?
Pre-market Outlook:
MU: Currently around 1132; consider entering near 950–1050, adding to the position near 850, and exiting in the 1300–1350 range.
BE: Currently around 257; consider entering at this level, adding to the position near 225, and exiting in the 310–320 range.
MRVL: Currently around 265; consider entering at this level, adding to the position near 240, and exiting in the 310–320 range.
TSLA: Currently around 379; consider entering at this level (no specific level for adding to the position), and exiting in the 420–430 range.
ARM: Currently around 332; consider entering at this level, adding to the position near 300, and exiting near 400.
If you are really Risk Averse, consider Invesco S&P 500 UCITS ETF
The fund is designed to track the performance of the S&P 500 Index, which consists of approximately 500 of the largest publicly traded companies in the United States. It gives you exposure to about 80% of the total U.S. stock market by market capitalization.
What does it invest in?
Although the ETF tracks the S&P 500, this particular Invesco fund uses synthetic replication. This means:
It holds a diversified basket of securities.
It enters into swap agreements with counterparties to deliver the return of the S&P 500 Index, rather than owning all 500 stocks directly. This approach is intended to closely match the index's performance.
Largest holdings (through S&P 500 exposure)
As of April 2026, the biggest companies represented include:
Company Approx. Weight
NVIDIA 7.9%
Apple 6.5%
Microsoft 4.9%
Amazon 4.2%
Alphabet (Class A) 3.6%
Broadcom 3.2%
Alphabet (Class C) 2.9%
Meta Platforms 2.2%
Tesla 1.7%
Berkshire Hathaway 1.4%
Sector allocation
The ETF is heavily weighted toward technology because the S&P 500 is market-cap weighted.
Information Technology – ~31%
Financials – ~14%
Consumer Discretionary – ~11%
Health Care – ~9.5%
Industrials – ~9%
Communication Services – ~9%
Consumer Staples – ~5%
Energy – ~4%
Utilities – ~2.5%
Other sectors make up the remainder.
Geographic exposure
Although it is a UCITS ETF domiciled in Ireland, the companies it tracks are overwhelmingly U.S.-based:
United States: ~98.9%
United Kingdom: ~0.6%
Ireland: ~0.4%
Netherlands: ~0.1%
Why investors choose it
Very low annual fee (around 0.05% ongoing charge).
Broad exposure to leading U.S. companies.
Suitable for long-term investing.
Accumulating share classes automatically reinvest dividends, while distributing share classes pay dividends out.
If you're investing monthly (for example, as part of your long-term wealth-building plan), this ETF is commonly used as a core holding because it provides diversified exposure to many of the world's largest companies in a single investment.
Stock Ticker: SPCX
Position: Long
Entry Price: Approx. $152
Target Price: $180
Investment Thesis:
Explosive growth in Starlink subscription revenue, with a user base exceeding 10 million; projected 2025 revenue of $114 billion and gross margins exceeding 60%
Active advancement of Starlink’s Phase 3 operations (mobile connectivity and direct-to-cell services) and strong growth in international markets (covering 164 countries)
Monopoly-like advantage in commercial launch services; Falcon 9 and Falcon Heavy dominate the global market, backed by major long-term contracts with NASA and the Department of Defense (DoD)
Continued expansion of AI operations (xAI data centers + Grok), achieving superior cost efficiency through vertical integration
Technical Analysis: Strong upward trend; a pullback to the $152 level presents an excellent buying opportunity
NVIDIA (NVDA) 5-Minute Smart Money Entry Strategy
This chart illustrates the classic Smart Money Concept (SMC) setup for NVIDIA (NVDA) on a 5-minute timeframe.
NVIDIA (NVDA) forms a strong uptrend with multiple Breakout Structures (BOS), attracting momentum traders.
Subsequently, the price fails to make a new high, indicating weakening buying pressure and a potential nature reversal (CHoCH).
Smart money accumulates liquidity above previous highs and in the premium zone, trapping late buyers.
After the liquidity runs out, the price reverses sharply and retests the supply zone, creating a high-probability shorting opportunity.
Multiple Bearish Structures (BOS) confirm institutional selling pressure and further downward momentum.
Key Takeaways:
Many retail traders buy breakouts without understanding where the liquidity is. Smart money typically locks up these liquidity pools before pushing the price in the expected direction. Instead of chasing prices, wait for:
• Liquidity sweep
• Choch confirmation
• Supply and demand zone retracement
• Structure breakout (BOS)
These elements can significantly improve trade quality and risk management.
Have you used the "smart money" concept when trading stocks like Nvidia (NVDA), Tesla (TSLA), PLTR, or AMD?
Please comment "SMC" below and share your thoughts.
For educational purposes only and does not constitute investment advice.
The Federal Reserve's interest rate policy has entered the "post-high interest rate era," but the real question is: when will the effects of high interest rates be fully transmitted to the real economy?
I have been studying U.S. stocks for 25 years. Here are some investment rules every stock beginner should remember:
Price drops 10% → Hold
Price drops 20% → Add 10%
Price drops 30% → Add 30%
Price rises 10% → Continue holding
Price rises 20% → Still hold
Price rises 30% → Sell 10%
Price rises 40% → Sell 20%
Price rises 50% → Sell 30%
Price rises 60% → Sell 40%
Price rises 100% → Sell everything
Like and follow me, and I’ll share more detailed investment guides for free.
📉 Last Friday, the U.S. stock market experienced one of the most aggressive single-day selloffs in recent years, abruptly cooling off the AI-driven rally that had fueled markets for the past two months.
The technology sector took the hardest hit:
• The Nasdaq Composite ($IXIC) dropped 4.18% in a single session, marking its worst performance since April 2025.
• The Philadelphia Semiconductor Index ($SOX) plunged 10.3%, recording its largest one-day decline since March 2020.
In just one trading day, U.S.-listed semiconductor stocks erased nearly $1.3 trillion in market value. 💥
What triggered the selloff?
Looking back at this dramatic week, the market was hit by a double blow from both industry-specific and macroeconomic pressures.
On the industry side, $AVGO (Broadcom) sparked the first wave of weakness after delivering earnings that disappointed market expectations, igniting a pullback across semiconductor stocks.
Meanwhile, discussions surrounding $NVDA (NVIDIA)’s Vera Rubin NVL72 system and its CPU-side memory configuration intensified, forcing investors to reassess future memory demand expectations tied to AI infrastructure.
Adding further pressure, Anthropic publicly warned about the potential risks of “AI losing control,” which weighed heavily on sentiment across technology stocks.
But the real blow to the market came from unexpectedly strong macroeconomic data.
📊 U.S. nonfarm payrolls increased by 172,000 in May, while the unemployment rate held steady at 4.3%.
As soon as the stronger-than-expected jobs report was released, expectations for another Federal Reserve rate hike this year surged sharply. At one point, markets priced in nearly a 70% probability of another hike, becoming one of the biggest headwinds for equities.
But is that really the whole story?
Is the current market selloff truly just about a strong economy and rising rate hike expectations?
Or is there something deeper happening beneath the surface?
Does this signal the end of the current bull market — or simply a healthy reset after months of AI-fueled optimism?
📈 The real answer may be far more complicated than the headlines suggest.
#USStocks #NASDAQ #AI #NVDA #AVGO #Semiconductors #StockMarket #Investing #Fed #TechStocks
Looking for new accounts to follow! I’m trying to share more AC content and need some inspiration 🥺 so if you are still active on AC, please RT so I can follow you (if I don’t already 😅🙈).