Just published a new viz and found that:
🧠 >8 hrs of screen time/day → lower mental wellness
💪 15–30 mins of exercise/day → big boost in mental health
Check it out 👉 https://t.co/k9UUuKTiRO
#DataViz#Tableau#MentalHealth#StorytellingWithData
Just published my latest Tableau viz! 📊🍿
Explored Netflix catalogue dataset using presentation-style and smoother narrative so viewers can follow the story behind the data.
Check it out 👉 https://t.co/hMkxnDPewt
#DataViz#Tableau#Netflix#Data#StorytellingWithData
My #MakeoverMonday Week 39 (2025) viz is live! 📊✨
This week I explored UK household spending in 2024. I learned to create a radar chart and using customised icons as filter!
Check it out 👉 https://t.co/2Jg8KhnJRw
#DataViz#Tableau#StorytellingWithData
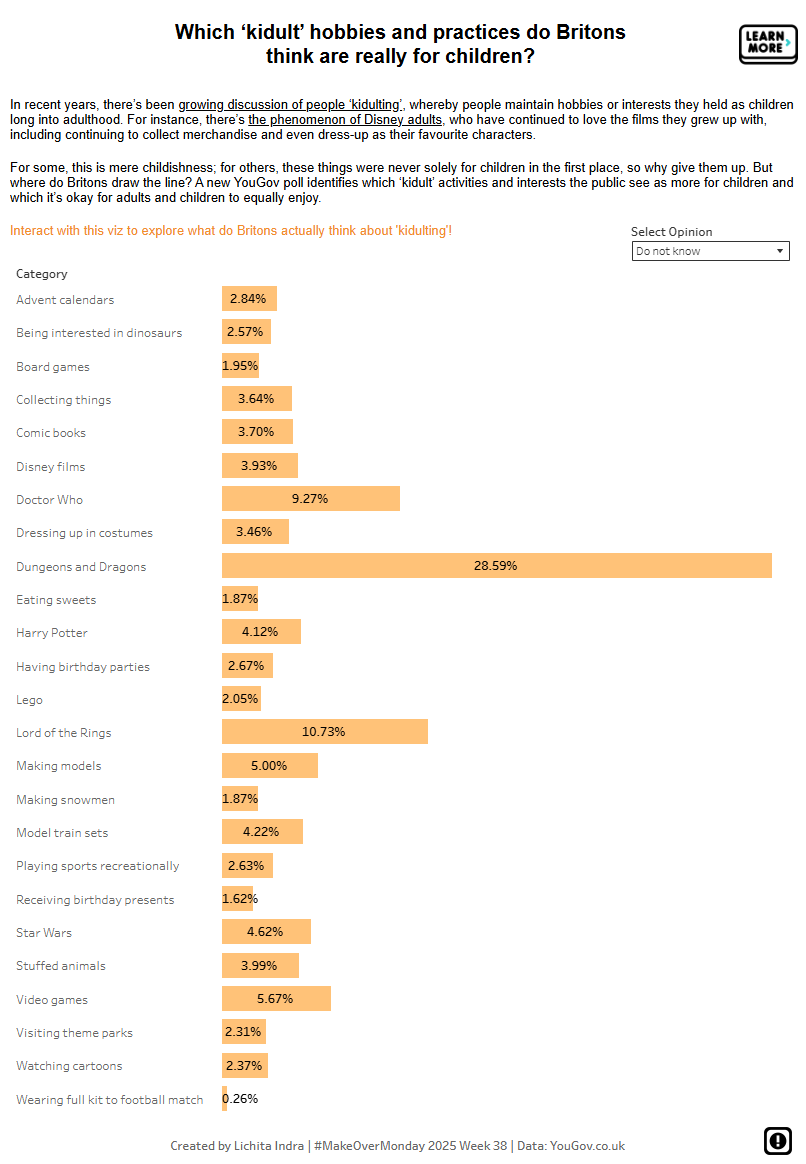
My 2nd #MakeoverMonday viz is live! 📊
This week I explored 'kidult' hobbies that are considered as childish in the UK! I focused on making the story clearer with Tableau.
Check out my viz and interact with it👉 https://t.co/0EDyRMKh3P
#DataViz#Tableau#MakeoverMonday
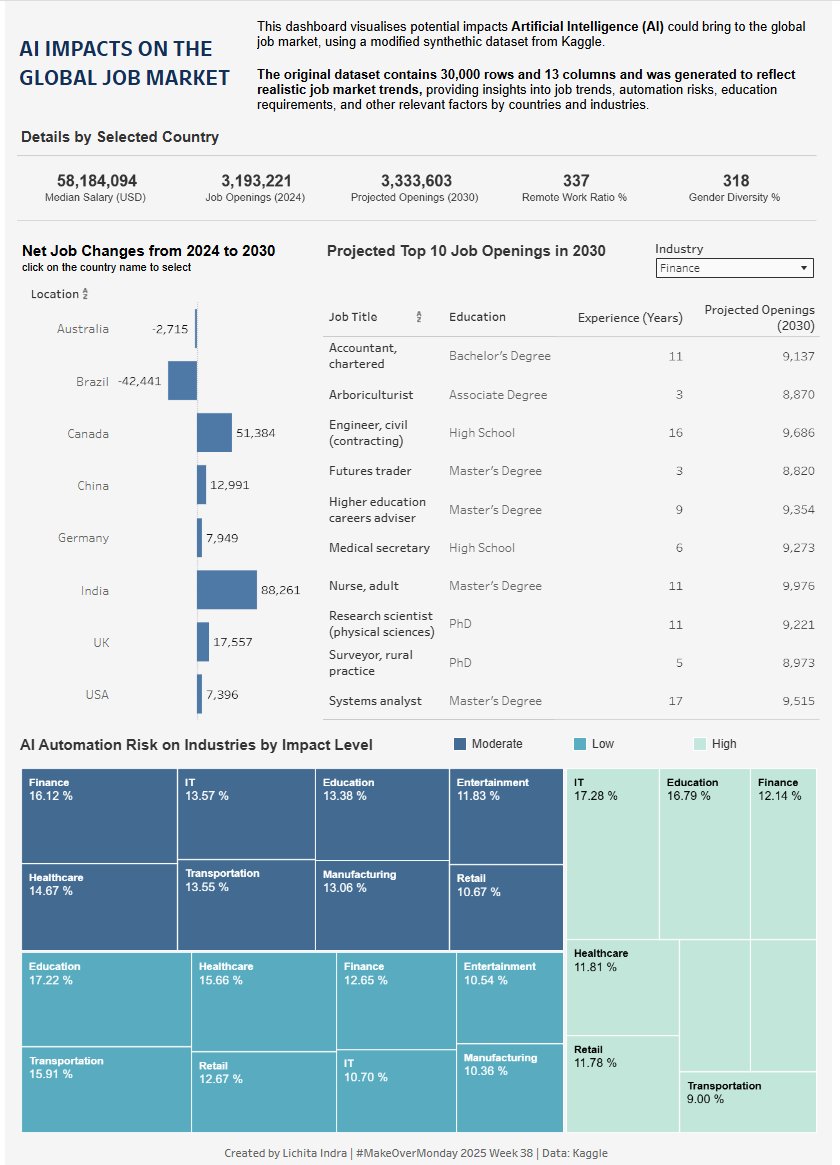
Took part in #MakeoverMonday for the very first time! 🚀
For Week 37 (2025), I worked with a dataset on the impact of AI on the global job market (2024–2030). I look forward to improving my skills through this weekly challenge!
👉 Check out the viz here: https://t.co/ppPm5vR0ip