I focus on technical structure in US stocks.
No predictions.
No narratives.
No hype.
Just price, levels, and how the market reacts around them.
If you value clarity over noise you’re in the right place.
$RDDT
Weekly view price respected the trendline perfectly and has been climbing ever since.
Now it’s testing the 50% Fibonacci level around $200, which is acting as resistance.
As long as price holds above $112, I wouldn’t be surprised to see $380 in the coming months.
Every dip into support is a buying opportunity in my view.
Letting the chart lead.
$RIVN
Monthly view this is starting to get interesting.
If we get confirmation with a breakout of the triangle, the upside potential could be significant.
Added to the watchlist.
I’m not posting the weekly or daily charts because, for now, they’re still a complete mess. The monthly chart is the one that has my attention.
$ETOR
Weekly view if price can reclaim $45 and get back above the weekly MA50 (🔵), the chart becomes much more interesting.
Two major objectives would immediately come into play.
From a risk-to-reward perspective, this looks like a great area to start building a position.
Waiting for confirmation. Let the chart decide.
$HOOD
Weekly view buyers have been stepping in and lifting prices over the past several weeks.
The structure is looking increasingly constructive.
I’m waiting for a breakout and weekly close above the 50% Fibonacci level.
Once that happens, I’ll be interested in taking action.
If confirmed, my objective is $135.
Patience until the trigger.
$KRKNF
the descending structure has been broken, and the MA9 / MA20 / MA50 are now acting as strong support.
Momentum is starting to shift bullish.
I wouldn’t be surprised to see the gap between this and the other space names close very soon.
From a risk-to-reward standpoint,
this is absolutely a trade I’m willing to size into aggressively.
$TSLA
The structure looks bullish.
Big money is positioning.
The market usually knows before the headlines do
and I’m not interested in guessing what Elon is or isn’t saying.
I just follow the chart.
And honestly, I wouldn’t be surprised to see $600 on this name by the end of the summer
but for that to happen, price has to keep holding above $400.
$ASTS Technical Update (Weekly)
The trend remains strong with rising lows on the weekly view.
Key levels to watch:
Resistance: $80 - $83
Support: $63 - $66
Entry/Add Zone: $52 - $56
The bullish thesis remains intact as long as the price stays above $50. A move below this level would require a re evaluation of the current structure.
$ASTI
Weekly view after a full year of consolidation through 2024,
price is starting to compress for the next phase.
Structure is tightening into a triangle, with buyers continuing to defend the rising trendline.
This kind of pressure build-up usually leads to expansion.
For now, patience.
Waiting for the breakout confirmation before getting aggressive.
The setup is getting very interesting.
$RKLB
This name just entered my positions today.
From a structure standpoint, this is an interesting spot.
As long as price holds above $74,
the path toward new highs stays open.
Compelling risk-to-reward here.
Letting price confirm.
$ASTS Technical Update (Weekly)
The trend remains strong with rising lows on the weekly view.
Key levels to watch:
Resistance: $80 - $83
Support: $63 - $66
Entry/Add Zone: $52 - $56
The bullish thesis remains intact as long as the price stays above $50. A move below this level would require a re evaluation of the current structure.
$ASTI
Weekly view after a full year of consolidation through 2024,
price is starting to compress for the next phase.
Structure is tightening into a triangle, with buyers continuing to defend the rising trendline.
This kind of pressure build-up usually leads to expansion.
For now, patience.
Waiting for the breakout confirmation before getting aggressive.
The setup is getting very interesting.
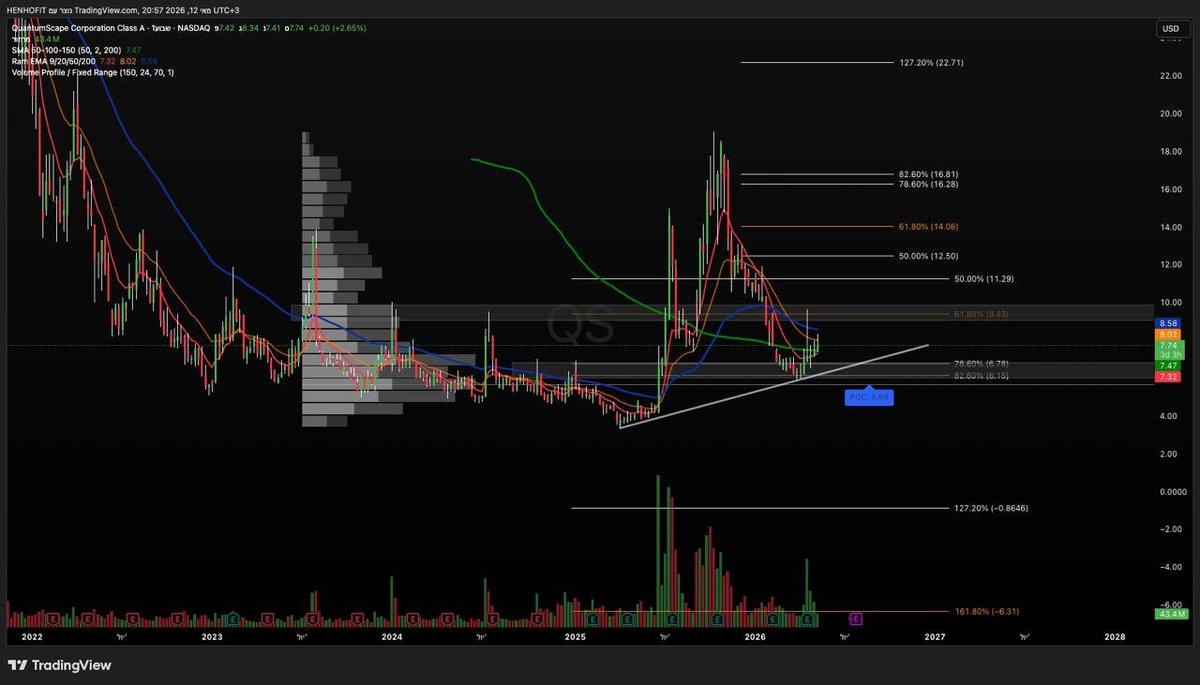
$QS
Weekly view after a strong rally, price is pulling back to retest the SMA200 (🟢) around the $6 area.
The MA9 / MA20 / MA50 are beginning to compress underneath price, while resistance aligns with the 61.8 fib.
As long as buyers continue stepping in, the structure remains constructive.
A reclaim above $9.43 would likely accelerate momentum significantly.
Risk-to-reward here is becoming very interesting.
$EOSE
Reclaimed the MA50 (🔵) structure shifting.
As long as price holds above $6.6,
the path toward $9.5 stays in play.
Lose that level, and the structure breaks down quickly.
Letting price confirm.
$RKLB
This name just entered my positions today.
From a structure standpoint, this is an interesting spot.
As long as price holds above $74,
the path toward new highs stays open.
Compelling risk-to-reward here.
Letting price confirm.
$SMR
Today we reclaimed the MA50 (🔵).
Structure is shifting.
As long as price holds above $12,
the path toward $16.5 stays in play.
Letting price confirm.
$UEC
Reclaimed the MA50 (🔵) and cleared the liquidity zone.
Structure flipped.
Now it’s about holding above $13.9.
If respected, the path toward $16 stays in play.
Letting price confirm.