Bitcoin Market Cycles: Why 70% Isn’t a Given
Recent volatility points to a familiar liquidity cycle. Gold and silver are taking profits, often a prelude to capital rotation rather than destruction.
Bitcoin’s history shows deep drawdowns:
•2011: ~93%
•2014–15: ~86%
Life’s all about energy and frequency.
Your frequency is proportional to the energy you consistently project.
Simple math. E ∝ f.
In trading, this hits different.
1) Markets move in waves ; liquidity, order blocks, FVGs, hammer reversals.
Collective energy creates the rhythm.
Your job is matching it with clean internal frequency.
NY session focus. Process first.
2) High frequency = disciplined execution.
Strict journal. 1% risk. 2.5R weekly limit enforced.
You read the setups clearly and wait for confirmation.
Low frequency = scattered mind, tilt, forced entries. Edge disappears fast.
3) Same principle applies across life.
Consistent energy output raises your baseline frequency.
No leaks. No shortcuts.
It compounds. Small daily raises beat sporadic spikes every time.
4) That’s how real edge is built from demo discipline to sustained results.
Say less. Think deeper. Move cleaner.
The market rewards alignment.
Check your frequency before the next session.
Tune it. Trade accordingly.
#Bitcoin #Trading #MarketPsychology
@gaiuschibueze Respect.
Moving to a new country and actually building something from an idea instead of just talking about it takes real discipline. Most people only consume the dream, few execute it.
Well done sir
@_nazatrades That schooling trained your mind to be sharper and operate better.
It wasn’t a waste of time depending on your view and what you used that time for
The squared relationship is illustrative, not a strict physical law, but the principle is powerful: small improvements in focus often produce disproportionately large improvements in trading behavior.
This helps explain why some weeks feel sharp and profitable, while others feel heavy despite the same screen time.
Markets are uncertain, but your process doesn’t have to be. Sustained, high-quality focus improves your ability to spot real edges, avoid impulsive moves, and execute consistently.
The goal is not more screen time.
The goal is higher-quality attention.
Master your focus intensity, and your entire trading system operates closer to its full potential.
Energy, Focus & Trading: A Mathematical Reality
I use mathematics to better understand reality; seeing how one thing relates to another.
In classical physics, many forms of energy scale with the square of a key variable.
Kinetic Energy:
E_k = ½ m v²
The energy in vibrating systems is also proportional to the square of amplitude.
This provides a useful metaphor for trading performance:
E-trading ≈ k × (Focus Intensity)²
Where:
E-trading = Quality of decisions, patience, and execution
Focus Intensity = Clarity, coherence, and presence while analyzing markets, waiting for real edges, and sticking to your rules
k = Your personal scaling factor (skill, process, experience)
Illustration:
Focus level 4 → Trading Energy ≈ 16 units (marginal decisions, forcing trades)
Focus level 6 → Trading Energy ≈ 36 units (+125%)
Focus level 8 → Trading Energy ≈ 64 units (+300%)
Most days, the improvements feel invisible.
You show up, review your trades honestly, fix one small leak, protect your sleep, wait for displacement instead of forcing absorption.
Nothing dramatic.
But mathematically, these tiny daily gains compound.
Let P(t) = P₀ × (1.01)^t
Where r = 1% daily improvement in execution, decision quality, and discipline.
After 504 trading days (≈24 months):
(1.01)^504 ≈ 150
Your performance becomes roughly 150 times stronger than when you started.
The curve starts almost flat.
Month 6: barely noticeable.
Month 12: you start trusting the process.
Month 24: the slope steepens dramatically - exponential divergence.
This is why persistence feels unrewarding early on. The compounding is quiet at first, then it accelerates.
The plotted graph showing how tiny daily improvements compound over approximately 24 months (~504 trading days).
Blue → 0.1% daily improvement
Orange → 0.5% daily improvement
Green → 1.0% daily improvement
You can clearly see:
Early growth appears almost flat.
Around the midpoint, acceleration becomes noticeable.
Near the end, the slope steepens dramatically , especially for higher consistency rates.
This is the mathematics behind why persistence feels “invisible” early but becomes transformative later.
You’re not hoping for one big leap.
You’re building the slope itself.
The mathematics rewards those who keep showing up.
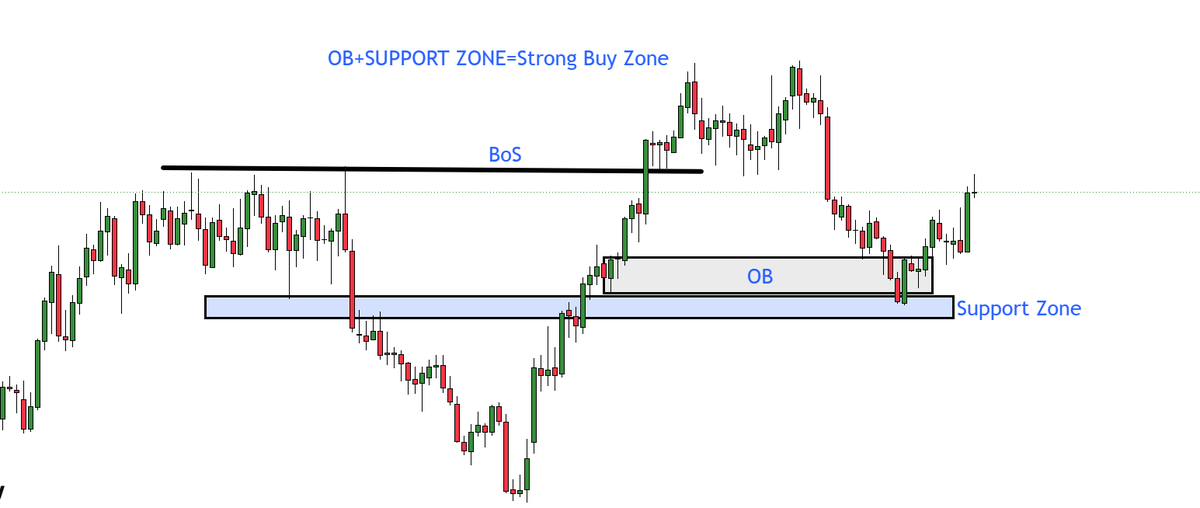
🚨OB + SUPPORT ZONE = STRONG BUY ZONE
✍️Confluence is key. When Order Block meets Support Zone, you get a high-probability buy setup.
✔️ OB (Order Block) – Smart money’s buy zone on the chart
✔️ Support Zone – Historical demand area where price has bounced before
✔️ BoS (Break of Structure) – Confirms trend direction before the pullback
✔️ Combined – OB inside a support zone = double validation = strong buy area
✍️ Look for a rejection candle at this confluence zone before entering. Don’t just buy because the zones overlap – wait for confirmation.
✍️Do you combine OB with traditional support/resistance?
✍️Share this to upgrade someone’s entry zones.
the chop has gotten to a point where even the strongest performers of the year like neet and troll have been moving sideways for 2-4 weeks
there's nothing exciting happening in the average cult coin watchlist because volume is just zero and btc sol eth don't help
this looks more and more like a generational bottom on memecoins
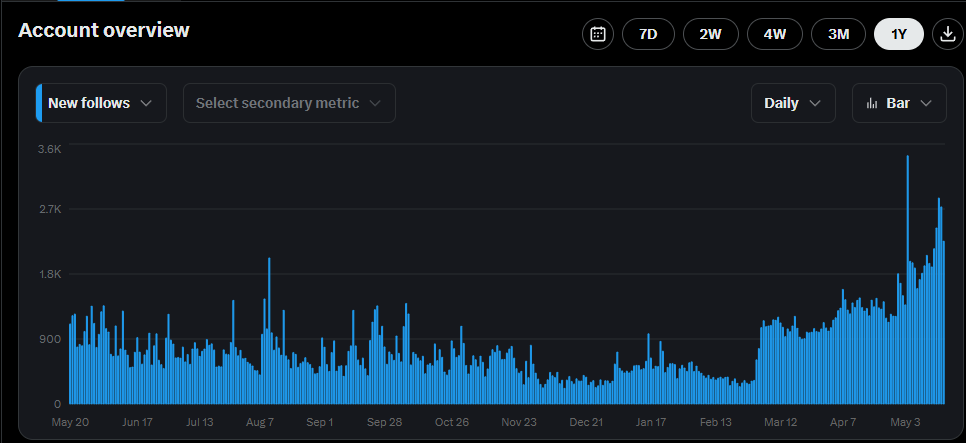
amount of new followers this account is getting has been a good retail indicator over past few years, seems like interest in crypto is ticking up again