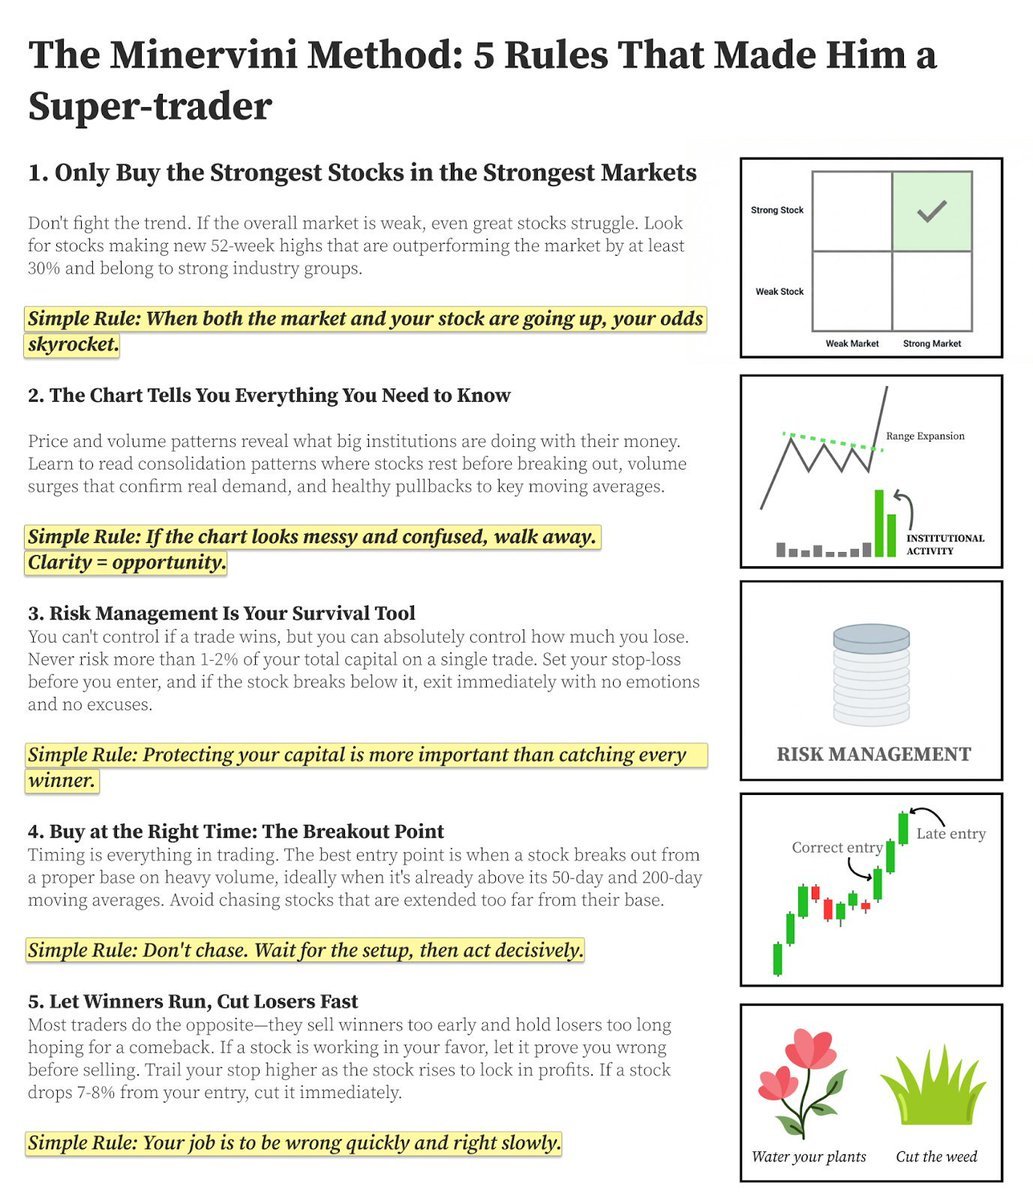
Mark Minervini turned $250,000 into $2.7 million in 15 months by following 5 Simple rules.
Most traders lose money because they break these rules.
This one-pager breaks down the exact framework that separates winning traders from everyone else.
#Trading
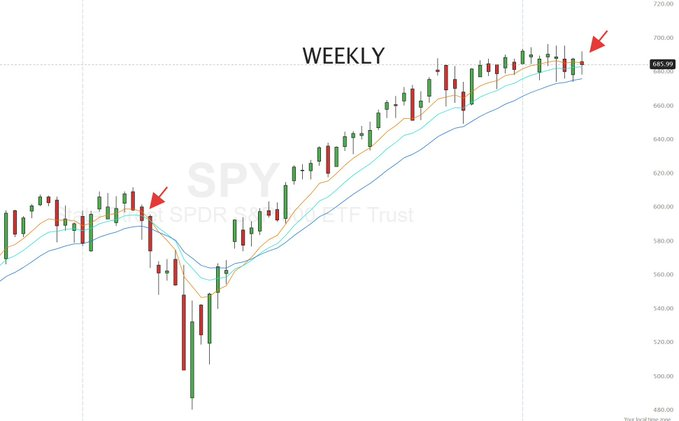
MARKET CORRECTION CLOSE
Last time the 8 EMA crossed under the 13…
We saw a correction.
The 21 EMA is the line.
Lose it → correction.
Hold it → melt-up continues.
Weekly tells you everything $SPY
$10,000 → $42,000,000
How Dan Zanger did it 🧵
Most people think it was luck.
It wasn’t.
It was a shift.
1️⃣ THE JOURNEY & THE SHIFT
• Lost money for years
• Inconsistent results
• Emotional trading
Then he discovered William O'Neil and his book
How to Make Money in Stocks
The realization:
👉 Charts & patterns matter
👉 Price + Volume are everything
Not opinions. Not news. Not predictions.
2️⃣ THE ZANGER PATTERN (The Setup)
He focused on:
📈 Strong uptrend
📦 Tight consolidation (Flag / Pennant)
🚀 Breakout above resistance
But here’s the key:
Breakout must happen with huge volume spike
That volume confirms:
✔️ Institutional buying
✔️ Real demand
✔️ Not a fake move
No volume = no trade.
3️⃣ VOLUME = FUEL
At breakout:
• Volume must be 50%+ above average
• Spike confirms momentum
• Institutions are entering
Retail traders chase candles.
Professionals watch volume.
4️⃣ DISCIPLINE & EXECUTION (The Real Edge)
His rules:
✔️ Wait for pattern + volume (don’t anticipate)
✔️ Cut losses quickly (around 7%)
✔️ Focus only on biggest movers
✔️ Avoid laggard stocks
Before:
Emotional. Random entries.
After:
Pattern-based. Risk-managed. Disciplined.
The Big Lesson 👇
He didn’t trade more.
He traded:
• Less
• Bigger setups
• With strict risk control
Edge = Pattern + Volume + Discipline.
I've created a WhatsApp group for $RKT shareholders and active traders to exchange insights and stay updated on the latest developments.
All investors are welcome to join!
Interested parties can subscribe first for future announcements.
$AEHL $EKSO $CETX $FLYE $ONTF $FONR
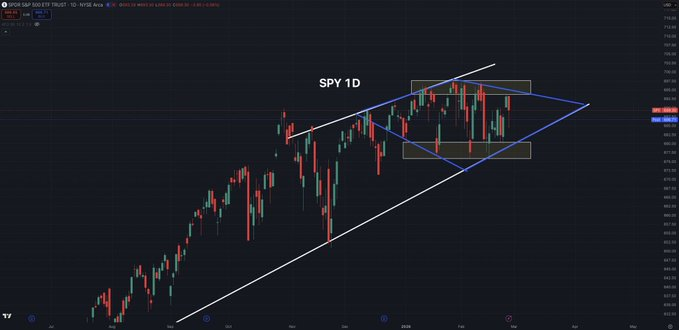
A generational short opportunity for $SPY is upcoming soon…
All indicators have aligned for an upcoming 10-12% correction on $SPY to $620.
The last time, I spotted a similar to this was February 2025 right before $SPY crashed -20%.
Trading solo is tough. Let’s team up. Free WhatsApp group with daily market trends, crucial updates & stock opportunities. We talk execution, learn from wins/losses. All are welcome. $NVDA $TSLA $BABA $MRNA $AMD $META $MSFT
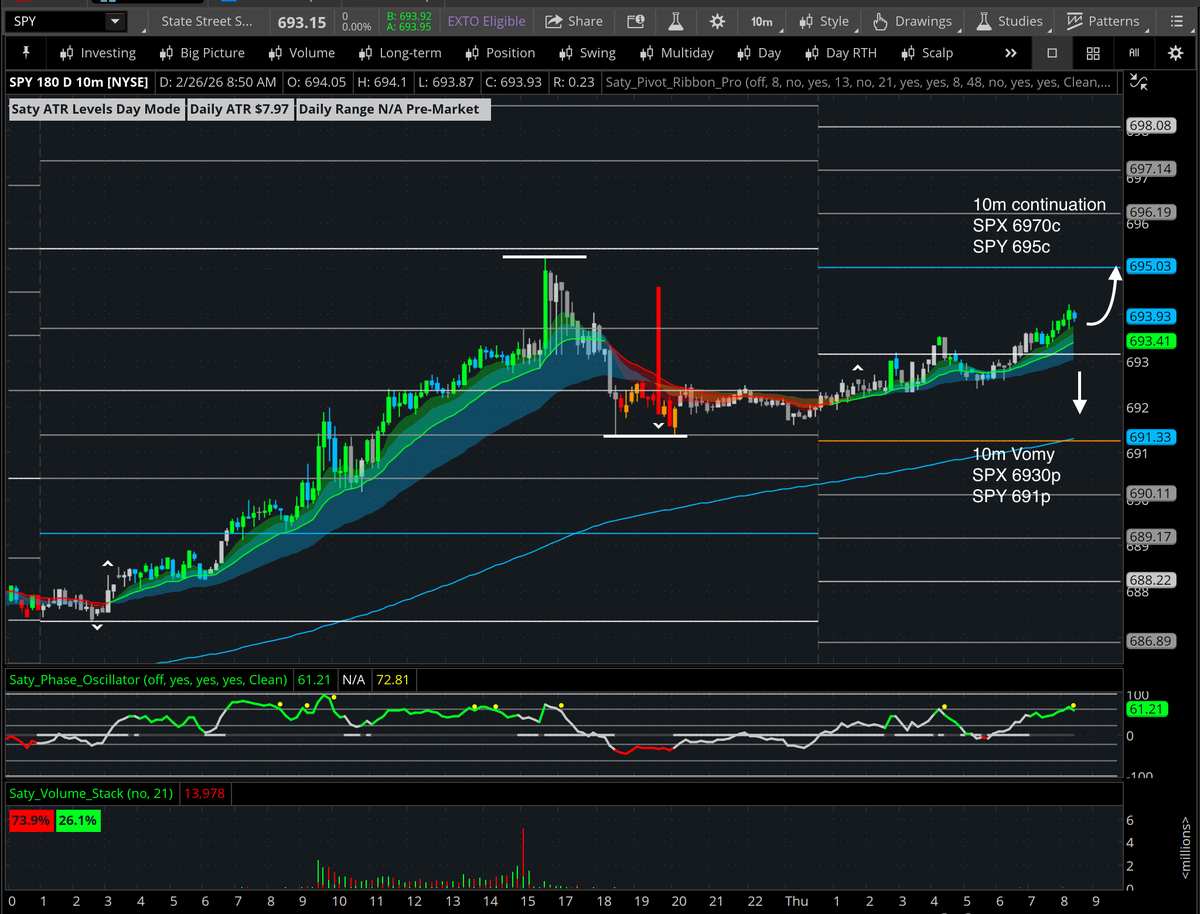
Day Trade Idea: $SPX | $SPY
Upside: SPX 6970c | SPY 695c
Downside: SPX 6930p | SPY 691p
VIX 17.5 key level
We are in the trigger box. Tomorrow we have PPI. 10m trend right now within the box. We are in Hourly (ETH) compression. Not much of a gap up right now so Gap Fill Thursday is not really worth it. NVDA likely to have an effect on direction after open. I will most likely trade NVDA IV flush at the open then come back to SPX/SPY to see what’s available.
- If we get trend continuation looking for a test of long trigger and overnight highs.
- If trend fails, look for a Vomy toward overnight lows and the short trigger.
7 Rules to Save Capital
1. Check chart first
2. No buying news after big run
3. Cheap can get cheaper
4. No downtrend buys
5. Don't hold downtrend for P/E
6. Be consistent
Discipline = Capital
🚨 INSIDERS DON’T WANT YOU TO SEE THIS
This was never meant for retail.
But I’m done watching people get liquidated by systems designed to extract their money.
These are the 4 execution models insiders run every single day.
Once you see them, price action will never look the same.
1. THE STOP HUNT (Model 1)
Nothing moves until liquidity is collected.
Price is pushed into a higher timeframe POI to punish everyone who entered too early:
- Lows get raided.
- Stops get harvested.
- Weak hands get erased.
Only after the damage is done do they shift market structure and print a fair value gap.
If you bought before the sweep, you weren’t early. You were exit liquidity.
2. THE TRAP (Model 2)
This is why even “smart” retail still loses.
Because the game doesn’t end after the first structure shift.
They add another layer.
An internal liquidity grab that looks clean, controlled, and irresistible.
Price moves up. You enter long.
Then comes one final flush to remove the last remaining hands.
Only then does the real move begin.
3. THE ALGORITHM’S PRICE (Model 3)
Institutions don’t chase price.
They calculate it.
They need the optimal entry, the 0.62 to 0.79 retracement window.
When a fair value gap sits inside that zone, the math aligns.
That’s where size enters.
Not before. Not after.
Everything else is noise.
4. THE RANGE TRAP (Model 4)
This is accumulation disguised as boredom.
Price gets locked in a tight range until you lose patience and close.
Then they fake a breakdown, sweep higher timeframe liquidity, and snap price straight back into the range.
That retest of the box isn’t support.
It’s institutions reloading before expansion.
THE REALITY
Every candle on your chart is engineered to make you act at the worst possible moment.
These aren’t “setups”.
They are the architecture of price delivery.
Billions move through these patterns while retail argues about indicators.
Bookmark this tweet. Study it.
You are either THE HUNTER or THE HUNTED.
I’m sharing this because I’m tired of watching good people get destroyed by a game they were never taught.
Remember, I’ve predicted all the market tops and bottoms for the last 15 years.
When I make my next move, I’ll share it here with my followers first, so you can copy my moves.
If you’re not following yet, you’ll understand why that was a mistake later.
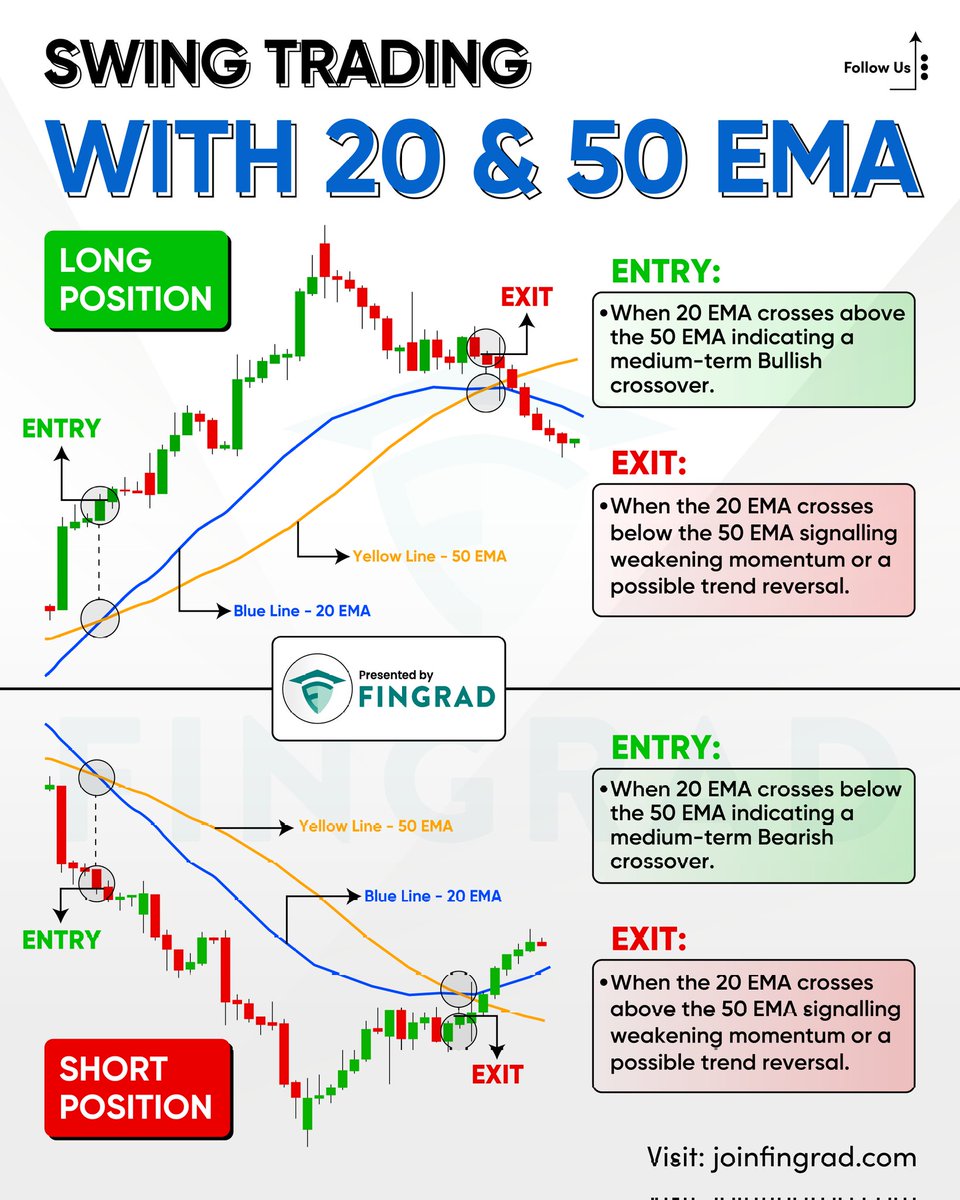
Trading with the 20 and 50 EMA (Exponential Moving Averages) is an established technical analysis method to identify trends, spot potential entry/exit points, and confirm price momentum across various timeframes and asset classes. This strategy leverages the responsiveness of the 20 EMA for near-term signals, while the 50 EMA acts as a reliable mid-term trend filter.
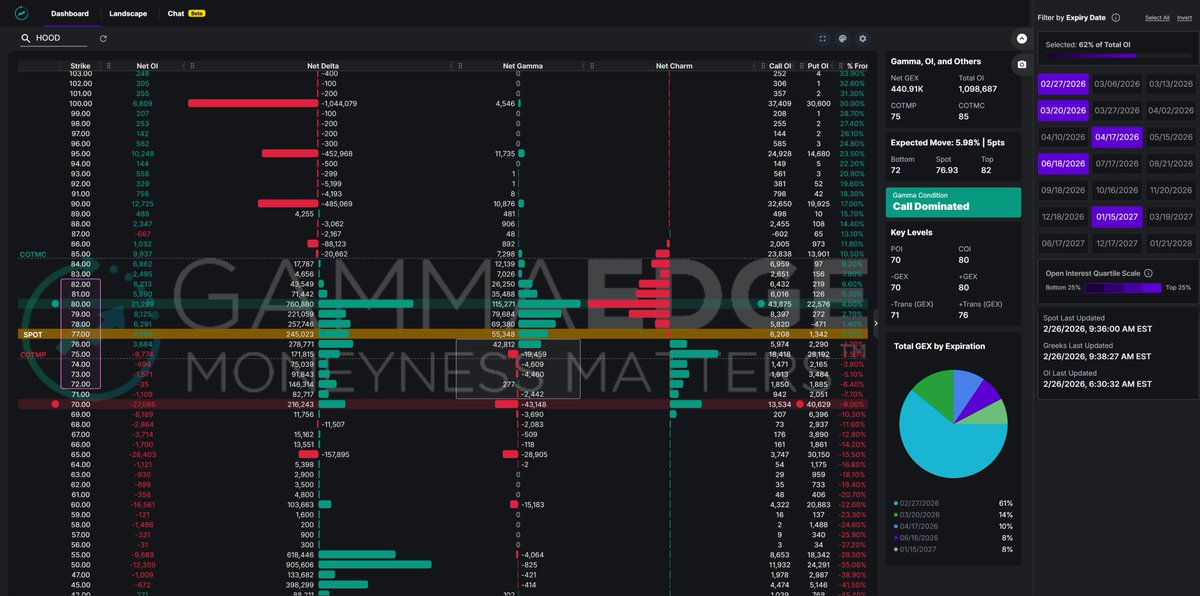
@RedDogT3 $HOOD structure continues to improve from an options standpoint. The move back above transition zone at
71-76 will be key area. The 80 strike will most likely be a cap on price until the structure advances higer as this is the highest call speculation area.
CAN $CRM FOLLOW $WDAY? AND WHY MEMORY WON’T BREAK
$WDAY delivered a textbook Red Dog Reversal-style move, reclaiming key levels and turning into a strong tactical trade.
Now the focus shifts to whether $CRM can follow with a similar move if it holds the $182 area and builds momentum higher.
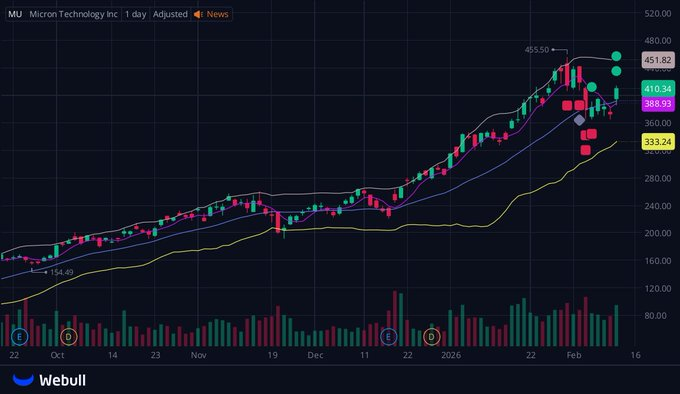
At the same time, memory stocks continue to show notable relative strength despite a short report on $SNDK.
Names like $MU, $STX, and $WDC are holding key moving averages and consolidating constructively.
If real buyers stay committed, weak shorts could fuel further upside.
If you enjoyed this video, please ❤️like and 🔁retweet
Give Me 12 Minutes & I’ll Teach You Every Major Trading Pattern:
1.Fibonacci
2.Breakout
3.Reversal
4.Elliott Wave
5.Fair Value Gap
6.Candlesticks
7.Heikin Ashi
8.Moon Phases
9.Renko
10.Harmonic Patterns http:
https://t.co/JRjV1wNi4L &Resistance
12.Dynamic Support and Resistance
13.Trendlines
14.Gann Angels
15.Momentum Indicators
16.Oscillators
17.Divergence
18.Volume
19.Moving Averages
20.Parabolic SAR ETC.
I've created a WhatsApp group specifically for $MU stock holders and active traders to facilitate communication, share insights, and access the latest information.
All investors are welcome to join!
Free to join: https://t.co/oYYKFxb6yj
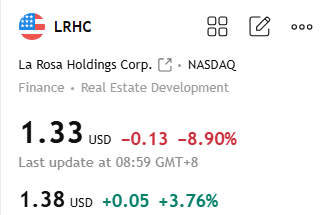
$LRHCNews: Sold 51% stake for $5M; cleared $5.5M debt; AI data center land deal. Strengths: Real estate + PropTech; AI shift; H1 '25 revenue +27% to $40.7M. Rise Today: Asset sale, debt reduction sparked rally; cash burn -25%.