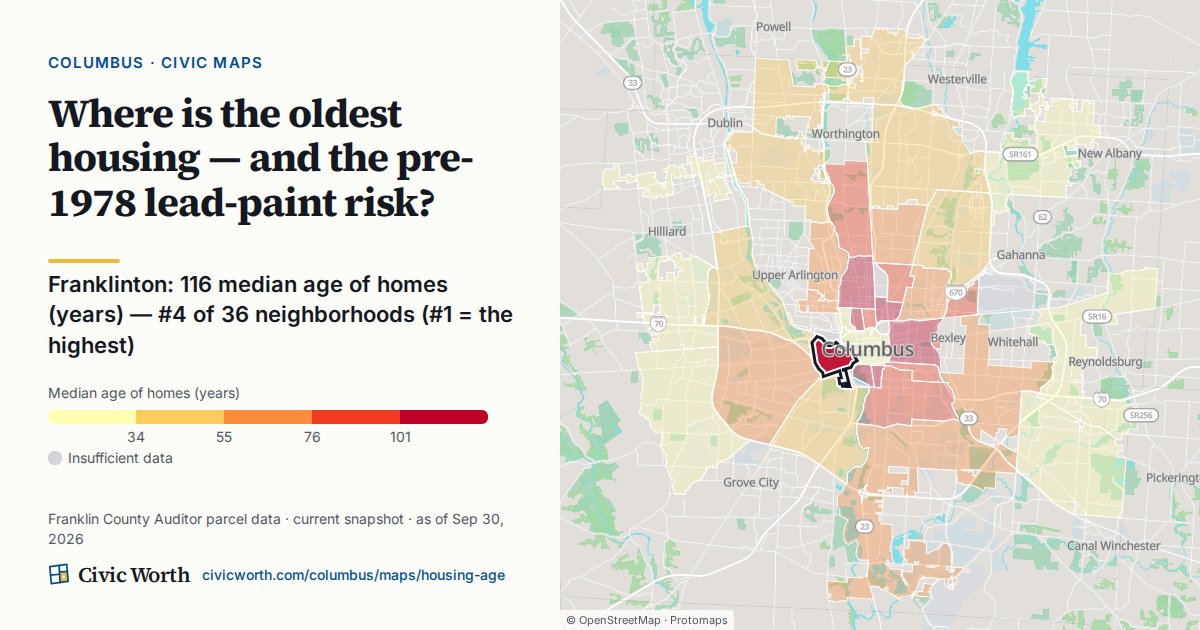
Franklinton: 116 median age of homes (years), #4 of 36 neighborhoods (#1 = the highest)
Citywide: 49 median age of homes (years).
(Franklin County Auditor parcel data, current snapshot, as of Nov 13, 2026)
https://t.co/Fn1eoTDhMm
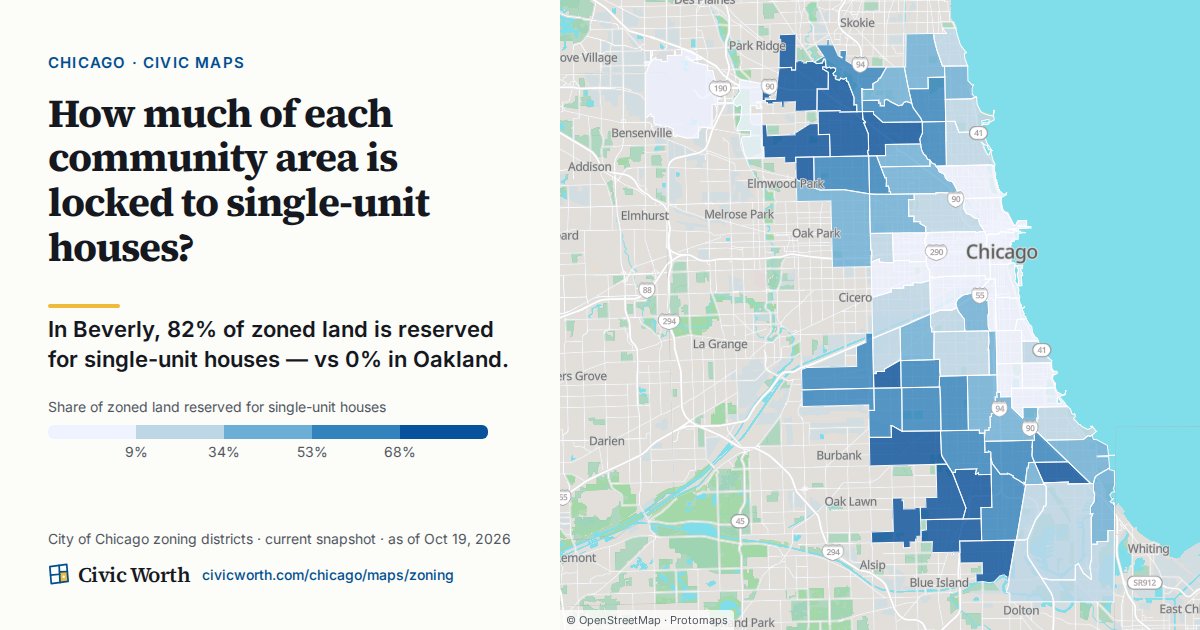
Grand Boulevard: 0.3% share of zoned land reserved for single-unit houses, #73 of 77 community areas (#1 = the highest share)
Citywide: 40% share of zoned land reserved for single-unit houses.
(City of Chicago zoning districts, as of Nov 5, 2026)
https://t.co/ie3GijmrTo
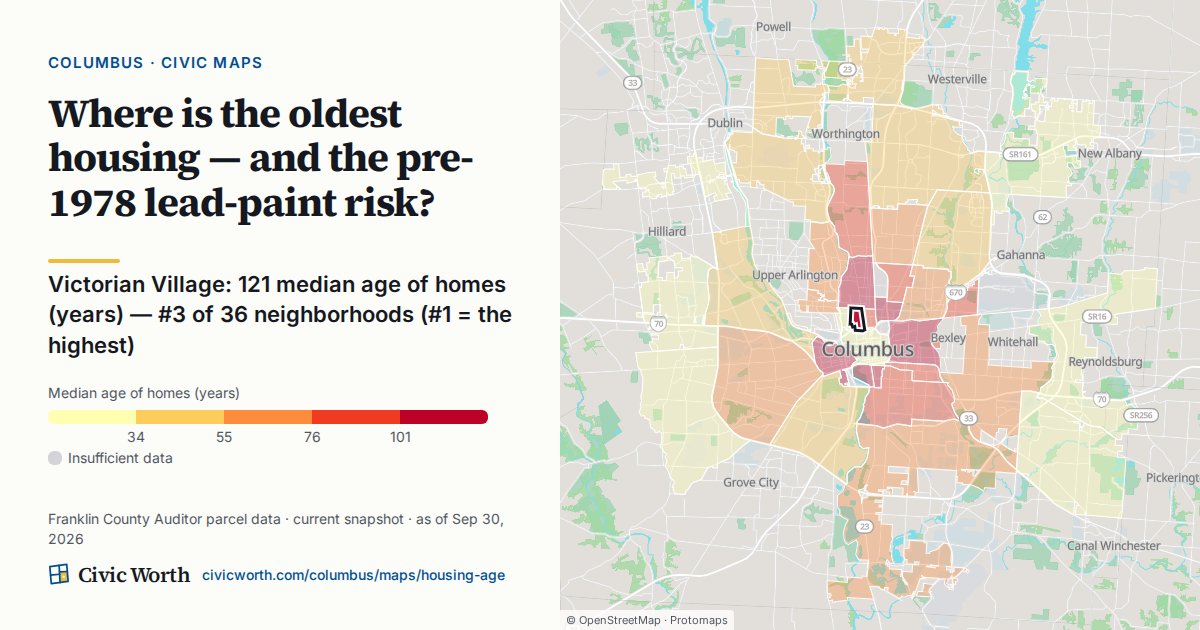
Victorian Village: 121 median age of homes (years), #3 of 36 neighborhoods (#1 = the highest)
Citywide: 49 median age of homes (years).
(Franklin County Auditor parcel data, current snapshot, as of Oct 30, 2026)
https://t.co/frEGX6wOCX
How to read it: Appeal rate is the share of a community area’s parcels that filed an appeal in the tax year. The ramp is neutral on purpose: a high rate can mean an engaged neighborhood or an active tax-appeal industry, so the map reports it rather than judging it.
Franklinton would spend 39.1% of the typical household income on the fair-market rent, the least affordable; German Village the most affordable (12.5%). What it does, and doesn't, measure.
https://t.co/8n2369029n
Loop appealed the most (85.4% of parcels); West Englewood the least (3.5%). Same county, same assessor, same tax year. How to read it for Gage Park, Albany Park, or yours.
https://t.co/jD26OVKzGN
Washington Heights: 6.6% parcels that appealed, #67 of 77 community areas (#1 = the highest share)
Citywide: 36.3% parcels that appealed.
(Cook County Assessor, Appeals, tax year 2024, as of Oct 23, 2026)
https://t.co/35OF7PSgk8
Who contests their assessment, and who wins a reduction?
Gage Park: 6.3% parcels that appealed, #68 of 77 community areas (#1 = the highest share)
Citywide: 36.3% parcels that appealed.
(Cook County Assessor, Appeals, tax year 2024, as of Oct 16, 2026)
https://t.co/R5EfOY3vFU
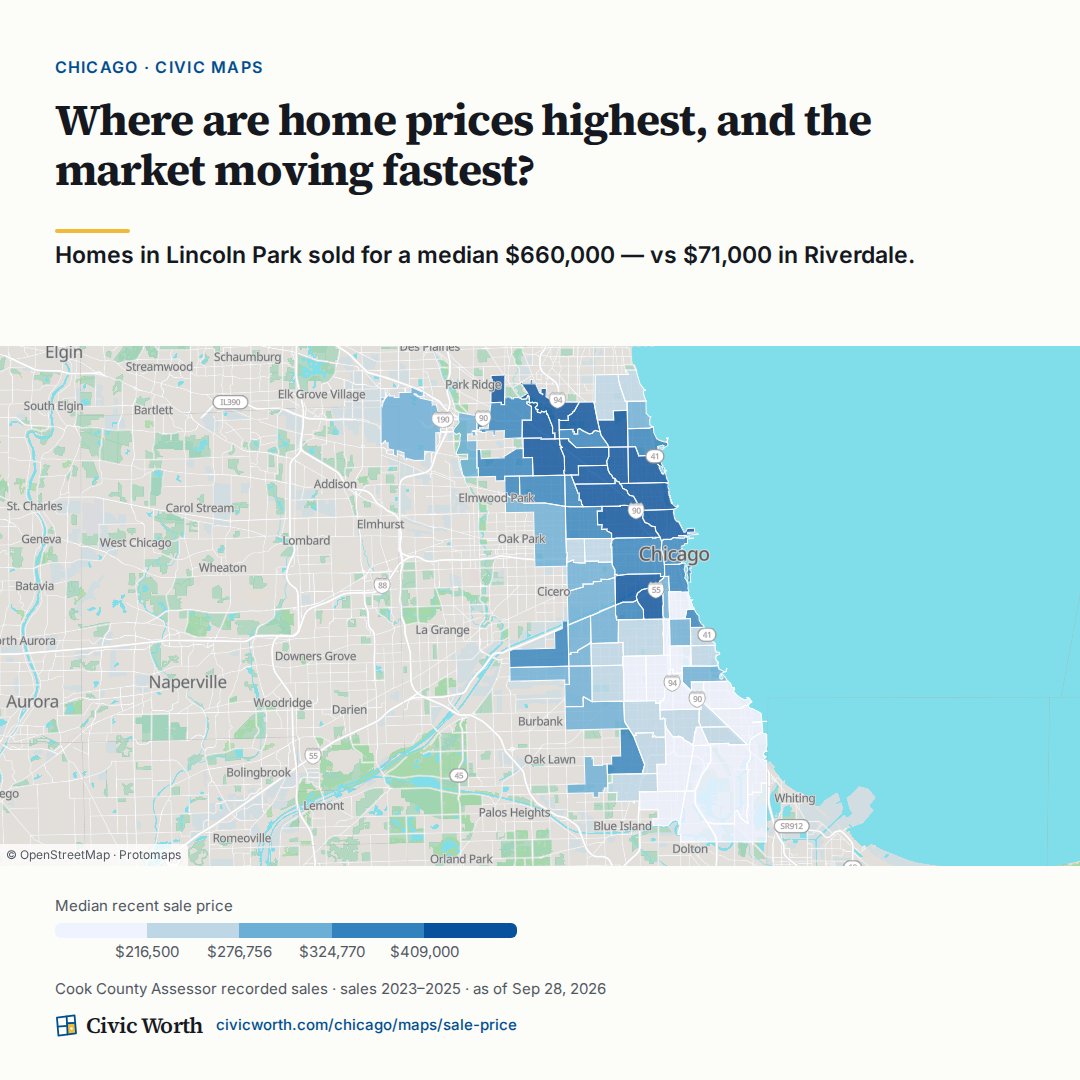
Homes in Lincoln Park sold for a median $660,000, vs $71,000 in Riverdale (Cook County Assessor recorded sales, 2023–2025). One number, zero explanation. Here's how to actually read that gap.
https://t.co/tdgC8djw8d
Far Northwest: $370,000 median recent sale price, #7 of 35 neighborhoods (#1 = the highest)
Citywide: $266,500 median recent sale price.
(Franklin County Auditor parcel data, sales 2023–2025, as of Oct 9, 2026)
https://t.co/PRo2tkCyAu
How to read it: TIF coverage is the share of a community area’s parcels that fall inside an active TIF district. The ramp is neutral, TIF is a contested tool, and this map reports magnitude, not a verdict.