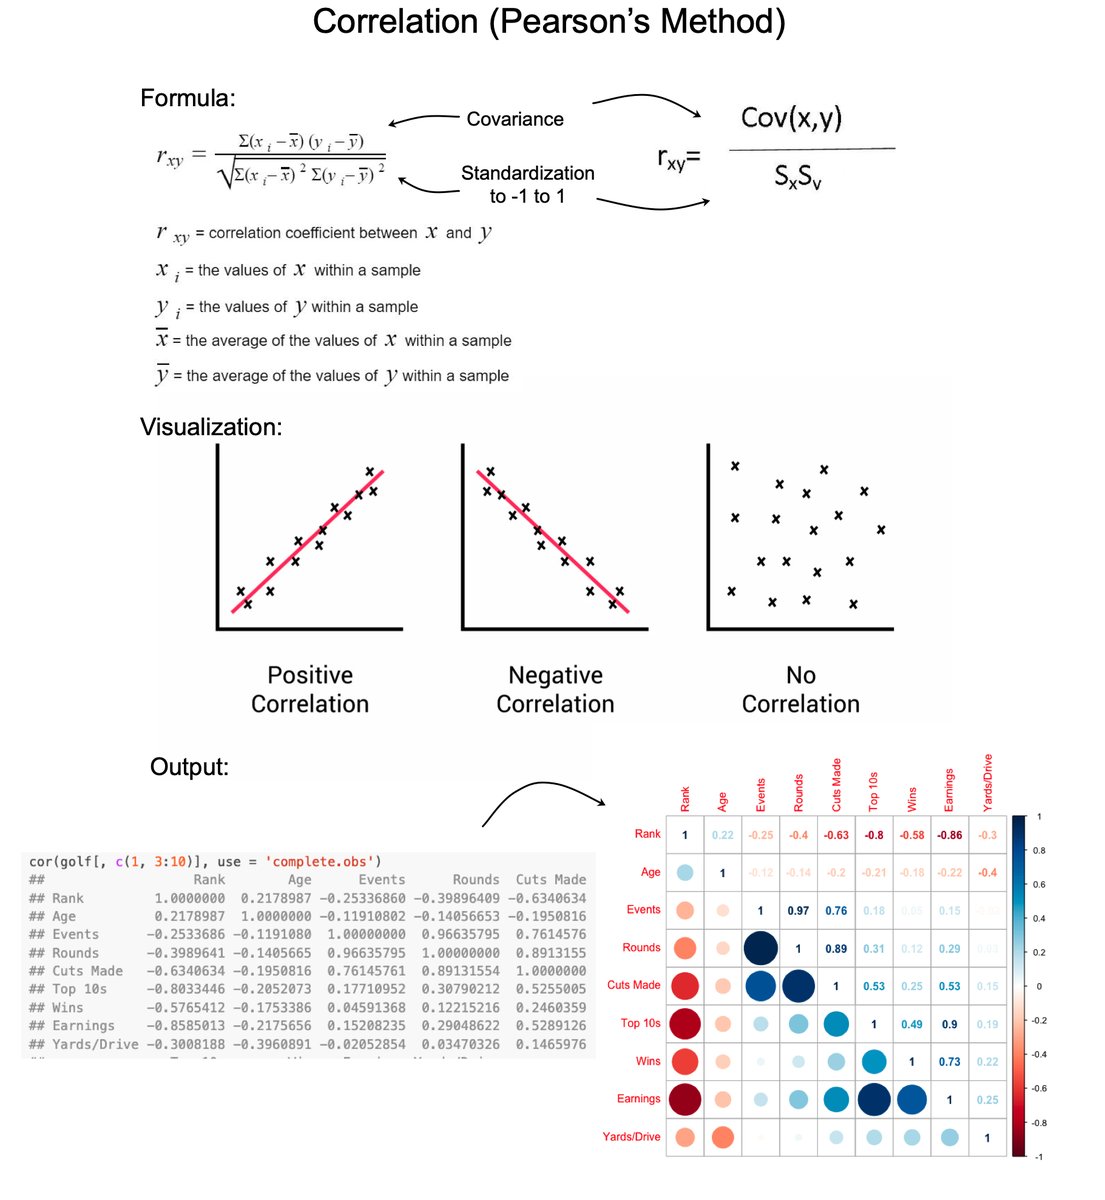
Correlation is the skill that has singlehandedly benefitted me the most in my career. In 3 minutes I'll compress what I learned in 10 years of using correlation to solve business problems.
1. Correlation: Correlation is a statistical measure that describes the extent to which two variables change together. It can indicate whether and how strongly pairs of variables are related.
2. Types of correlation: There are several types of correlation used in statistics to measure the strength and direction of the relationship between variables. The three most common types are: Pearson, Spearman Rank, and Kendall's Tau. We'll focus on Pearson since that is 95% of the time what I use.
3. Pearson Correlation: Measures the linear relationship between two continuous variables. The coefficient value ranges from -1 (perfect negative linear correlation) to +1 (perfect positive linear correlation), with 0 indicating no linear correlation.
4. Interpretation: Positive Correlation: This occurs when two variables move in the same direction. A positive correlation coefficient (closer to +1) indicates a strong positive correlation. Negative Correlation: This is observed when two variables move in opposite directions. A negative correlation coefficient (closer to -1) indicates a strong negative correlation. No Correlation: If there is no apparent relationship between two variables, this is referred to as no correlation or zero correlation.
5. Assumptions: Pearson correlation assumes that the variables are normally distributed and the relationship between the variables is linear.
6. Strengths: Pearson correlation is widely understood, easy to calculate, and easy to interpret. I use it as a preliminary step in every data analysis.
7. Weaknesses: Only detects linear relationships. Non-linear relationships, even strong ones, might go undetected or be poorly represented by the Pearson coefficient. Affected by Outliers: Pearson's correlation is sensitive to outliers, which can significantly distort the correlation coefficient, leading to misleading conclusions. Only works with numeric data.
8. How I Correct for Weaknesses: Non-linearity and lack of support for categorical data were big issues that led me to create an R package called Correlation Funnel. This corrects for non-linearity by binning numeric data and corrects for categorical data by one-hot encoding categorical data.
===
Ready to learn Data Science for Business?
I put together a free on-demand workshop that covers the 10 skills that helped me make the transition to Data Scientist: https://t.co/LR39RJ5XKB
And if you'd like to speed it up, I have a live workshop next week where I'll share how to use ChatGPT for Data Science: https://t.co/EaMpKrJiqX
If you like this post, please reshare ♻️ it so others can get value.