Portfolio Manager at SilverCape • Speculation is my ikigai • USIC '24 & ‘25 (+522%)
No posts should be misconstrued as financial advice. My only account. 📈
7 years in and I can safely say I've done something right to have @RichardMoglen and the @TraderLion team kindly grace me with an interview! 😆
It's a long one but hopefully my review of 2025 can bring you back to pivotal moments that made it such a special year! 📈
https://t.co/voizbLtKf7
"通常某個地方變咗Hard penny,就有另一個地方/時間變做Easy dollar"
This is the best thing I've heard all day today.
Translation: "When one area of the market turns into a hard penny environment, another area becomes an easy dollar environment."
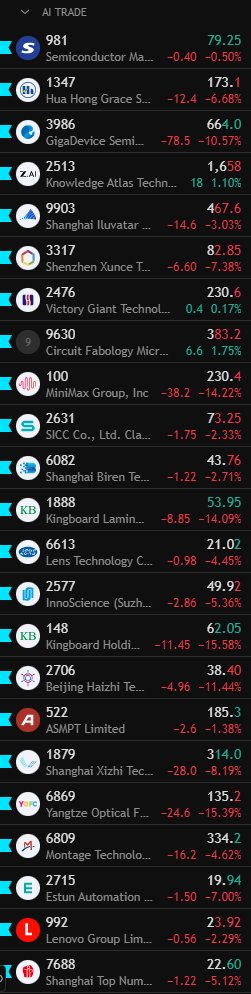
Case in point: Hardware vs Software
I don't think of trading in terms of differentiating entry tactics given the chart pattern!
Chart patterns are just label with really not much predictive value. But to your question, what I'm more interested in is the price/volume dynamic when a bear flag forms: i.e. is price wedging higher into declining moving averages on lower volume?
Similarly if you think about a bull flag, it's just the opposite - are you seeing constructive price/volume action as the stock pulls back into support?
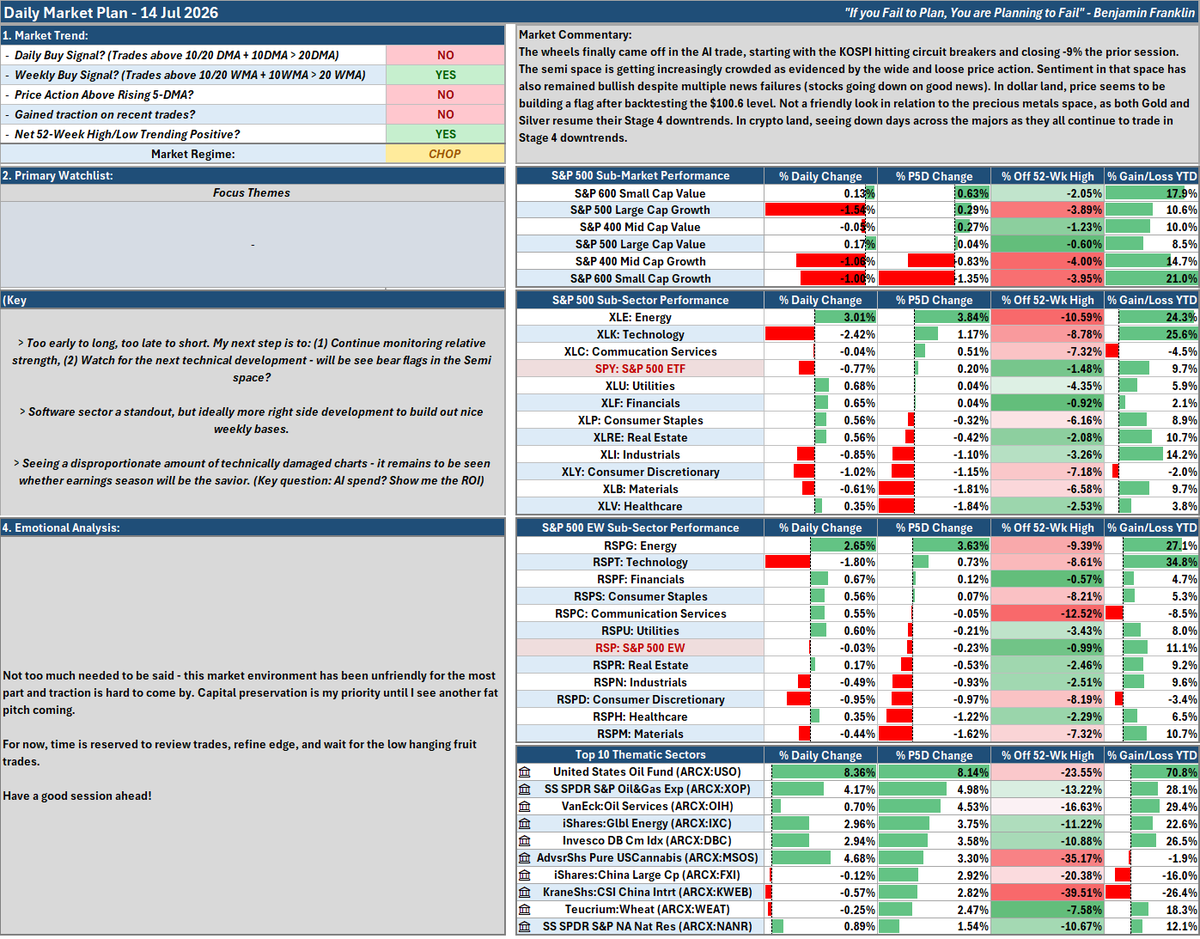
14 July 2026: The Path of Max Pain 🪓
Market Commentary:
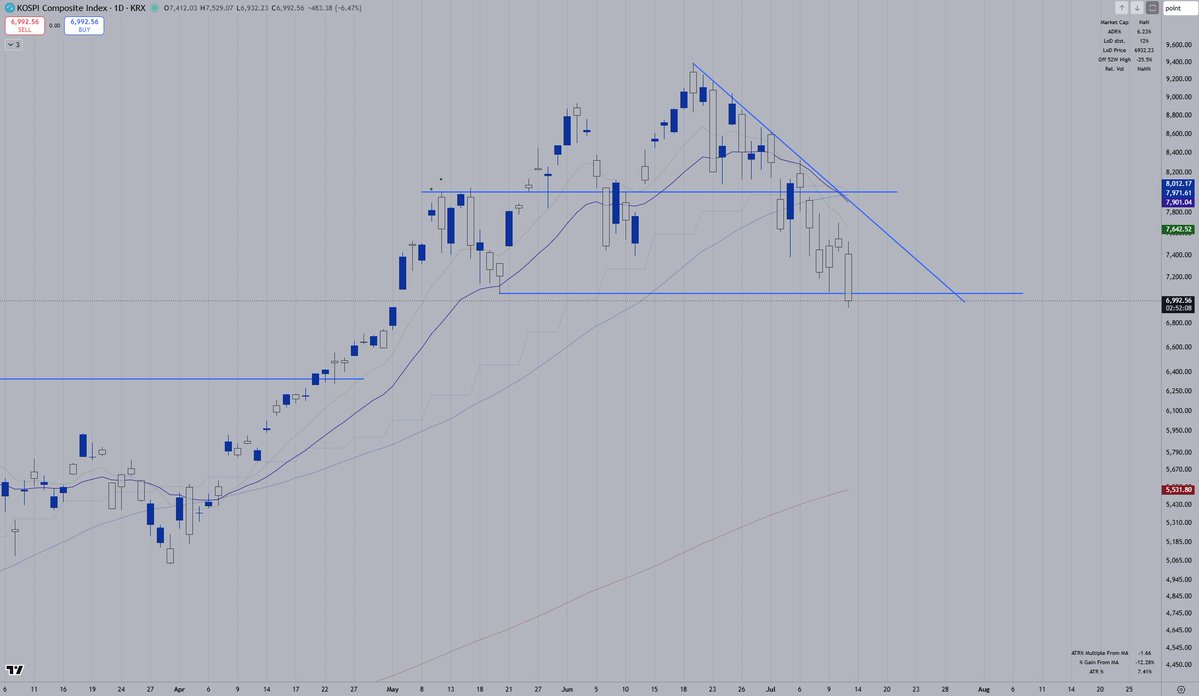
The wheels finally came off in the AI trade, starting with the KOSPI hitting circuit breakers and closing -9% the prior session. The semi space is getting increasingly crowded as evidenced by the wide and loose price action. Sentiment in that space has also remained bullish despite multiple news failures (stocks going down on good news).
In dollar land, price seems to be building a flag after backtesting the $100.6 level. Not a friendly look in relation to the precious metals space, as both Gold and Silver resume their Stage 4 downtrends.
In crypto land, seeing down days across the majors as they all continue to trade in Stage 4 downtrends.
A pretty dangerous technical picture as we seem to be in a transitioning phase (CHOP). Longs and Shorts will be difficult here.
Notes:
> Too early to long, too late to short. My next step is to: (1) Continue monitoring relative strength, (2) Watch for the next technical development - will be see bear flags in the Semi space?
> Software sector a standout, but ideally more right side development to build out nice weekly bases.
> Seeing a disproportionate amount of technically damaged charts - it remains to be seen whether earnings season will be the savior. (Key question: AI spend? Show me the ROI)
14 July 2026: The Path of Max Pain 🪓
Market Commentary:
The wheels finally came off in the AI trade, starting with the KOSPI hitting circuit breakers and closing -9% the prior session. The semi space is getting increasingly crowded as evidenced by the wide and loose price action. Sentiment in that space has also remained bullish despite multiple news failures (stocks going down on good news).
In dollar land, price seems to be building a flag after backtesting the $100.6 level. Not a friendly look in relation to the precious metals space, as both Gold and Silver resume their Stage 4 downtrends.
In crypto land, seeing down days across the majors as they all continue to trade in Stage 4 downtrends.
A pretty dangerous technical picture as we seem to be in a transitioning phase (CHOP). Longs and Shorts will be difficult here.
Notes:
> Too early to long, too late to short. My next step is to: (1) Continue monitoring relative strength, (2) Watch for the next technical development - will be see bear flags in the Semi space?
> Software sector a standout, but ideally more right side development to build out nice weekly bases.
> Seeing a disproportionate amount of technically damaged charts - it remains to be seen whether earnings season will be the savior. (Key question: AI spend? Show me the ROI)
7-10-26 Why The Low VIX Is Hiding Growing Market Risk
w/ @michaellebowitz
The $VIX remains near 16–17, suggesting investors expect a relatively calm market. But beneath that quiet surface, market conditions are becoming increasingly unstable.
One of the biggest warning signs is implied correlation, which measures how closely stocks move together. It has fallen to its lowest level in roughly 20 years.
That means while $SPX may appear stable, individual stocks are experiencing dramatically different price action. On any given day, some sectors are deep in the red while others surge higher, even if the index barely moves.
At the same time, realized volatility has nearly doubled since early June. In other words, actual day-to-day market swings have increased significantly, yet options traders continue pricing in relatively low future volatility.
Even after recent market selloffs and a wave of geopolitical headlines, the VIX barely reacted. That disconnect suggests headline indexes are masking growing internal turbulence.
This environment is becoming increasingly difficult for portfolio managers. The index looks calm, but stock selection is far more challenging as leadership rotates quickly and performance dispersion widens.
Positioning also remains aggressive. According to the National Association of Active Investment Managers, professional managers are still more than 84% invested after reaching nearly 99% exposure just days earlier. While many investors believe everyone is already "all in," that doesn't mean buying power has been exhausted.
Leverage could continue expanding, especially after margin rule changes that took effect on June 1 removed several restrictions on personal day trading. When June margin debt data is released, it will provide an important look at whether investors have significantly increased borrowing to stay invested. More leverage can continue fueling rallies, but it also increases downside risk if markets reverse.
We also stress that investors shouldn't focus solely on headlines surrounding war or oil prices. Liquidity remains one of the strongest long-term drivers of asset prices. As long as liquidity remains supportive, markets can continue climbing despite growing internal risks. But if liquidity begins to tighten while leverage remains elevated, today's calm-looking market could become much more volatile than the VIX currently suggests.
Check out our comprehensive "15 Trading Rules" guide ▶️https://t.co/T7MzH34WXd
This guide includes practical rules for managing positions, taking profits, controlling risk, and avoiding the emotional mistakes that often hurt returns during major market corrections.
If you like this video, please ❤️like and 🔁retweet
There's nothing wrong with sitting out and WAITING for an easier environment to come back.
I know people trading this tape daily, but it's experienced traders. Those who have the skills to ruthlessly manage risk.
If you're new, you're swimming in tricky waters here imo.
This isn't an easy market at all. It's totally cool to do nothing, because working your 'sit out power muscles' is a real thing too.
Overall feeling is more rest here is better than a early breakout in leading names that turns into exhaustion gaps (around earnings). More rest after an epic run in many of the leading names is not a bad thing in the middle of summer.
Generally summer markets are kept on cruise control and real action returns late August (the sell in May and go away always pans out in June or July as volume tapers of and action turns choppy).
Open to either direction not in a rush to make gains as this year as already been good and prespective is important given some names have run 100-300% and the chances of them going for another 100% run in the same year is very very small.