Did you read it yet?
The Fifth National Climate Assessment was released today. Check out the latest on U.S. climate change impacts, risks, and responses. #NCA5 https://t.co/2BiUb6IETV
NEW: The public draft of the Fifth National Climate Assessment is out for comment and we want to hear from you! Review the draft and share your feedback through January 27, 2023. Learn more here: https://t.co/DnbjAMZ6af #NCA5
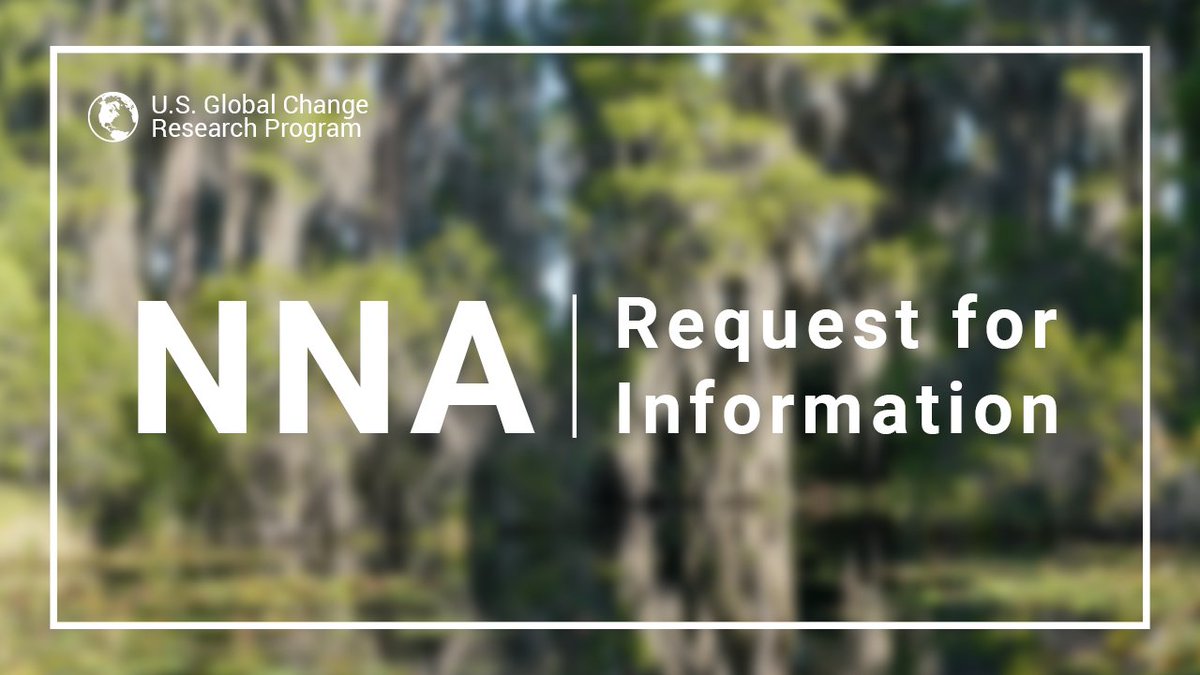
What does #nature mean to you? Share your thoughts and help inform the National Nature Assessment! Find out more, including how to submit your comments, here: https://t.co/Q4zHumERGD
I'm excited to announce our new #climate#indicators web series, developed by our awesome @NCState_NCICS intern, Alexis. Check out the first video here:
Check out our new series of YouTube videos exploring the @usgcrp#climate#indicators! First up, a short introduction to Indicators: https://t.co/ko6JLgUJmA
Wholeheartedly agree!
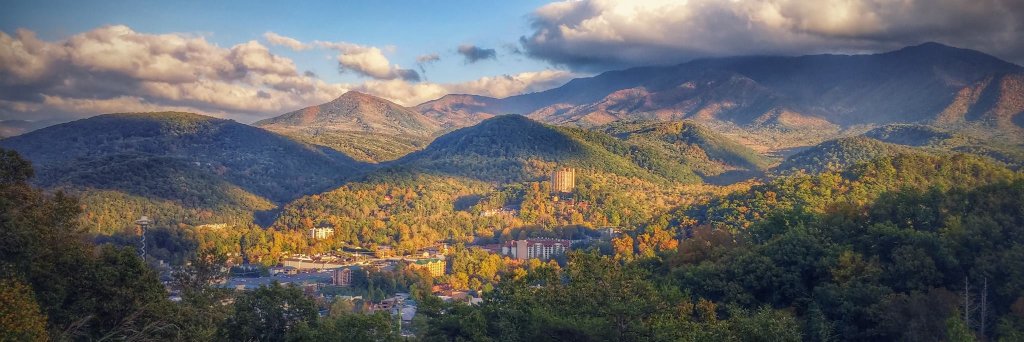
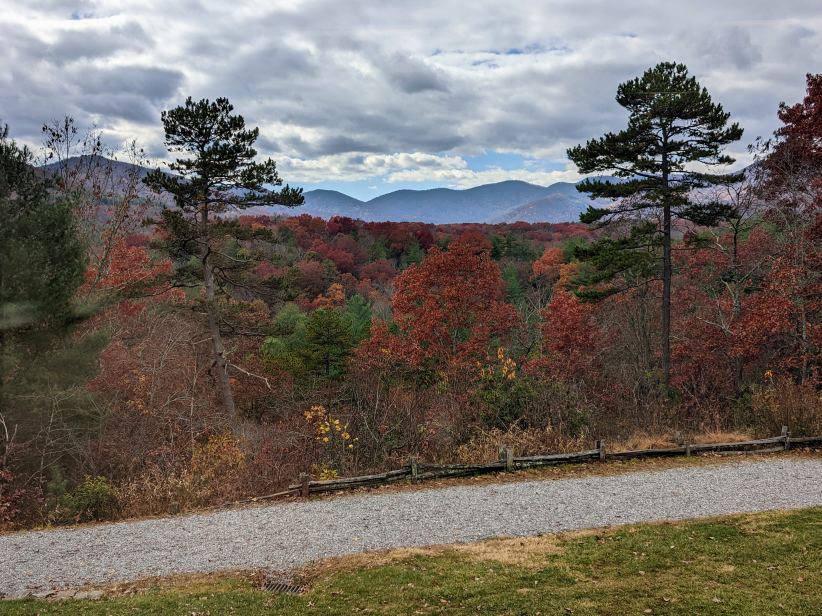
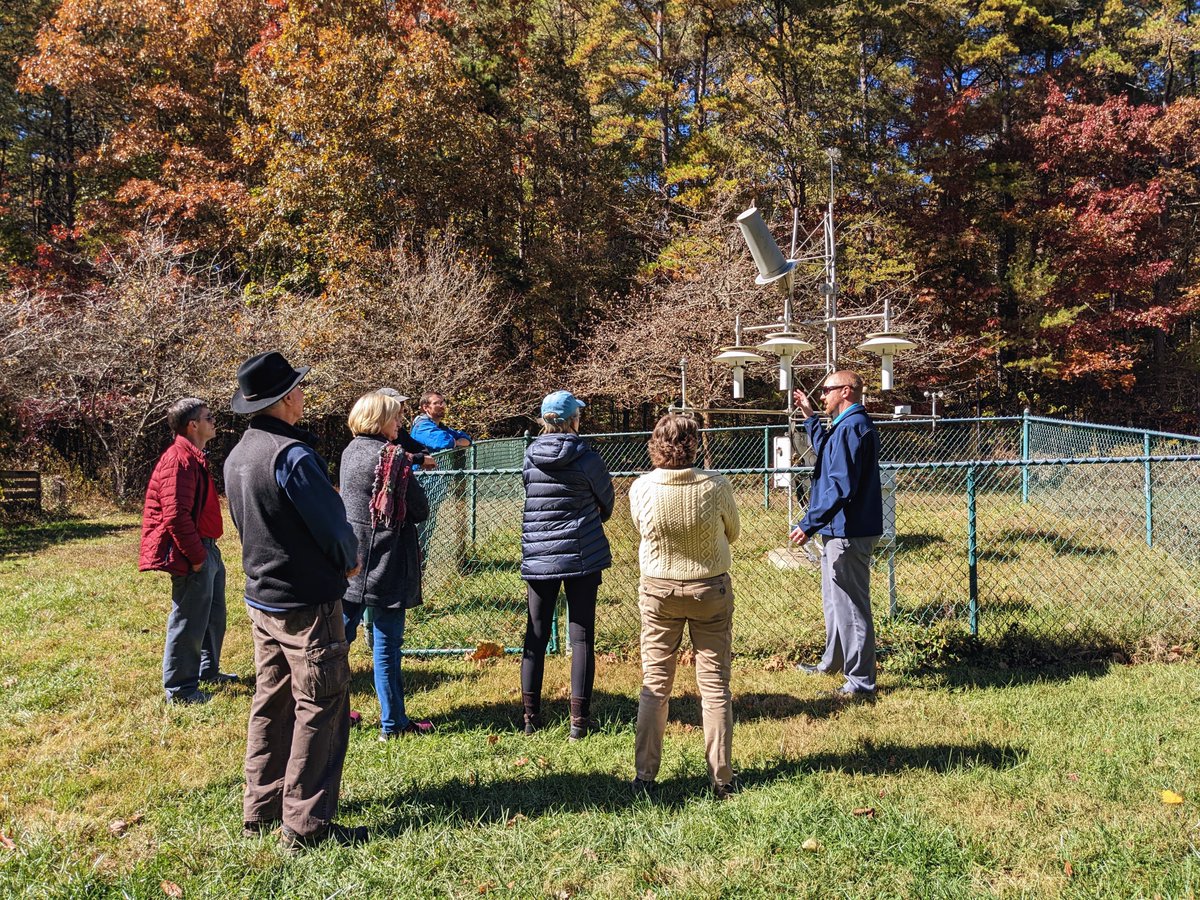
We enjoyed a trip to the U.S. Climate Reference Network station afterwards too. The beautiful fall color made the perfect backdrop.
Climate and weather events cause billions of dollars of economic damages every year in the United States. The @usgcrp Billion-Dollar Disasters indicator shows that these events are happening more often, and this trend is due in part to #climate change.
Calling all visual #artists! We’re looking for #art that can help us tell the story of #climatechange. Find out how to submit your work here: https://t.co/amBXP2m6Fg #NCA5
Deadline this week! @USGCRP will accept nominations for Review Editors for the Fifth National Climate Assessment until 11:59 PM ET, Friday, July 1, 2022, via its Public Contribution System: https://t.co/FKuSSOJszg
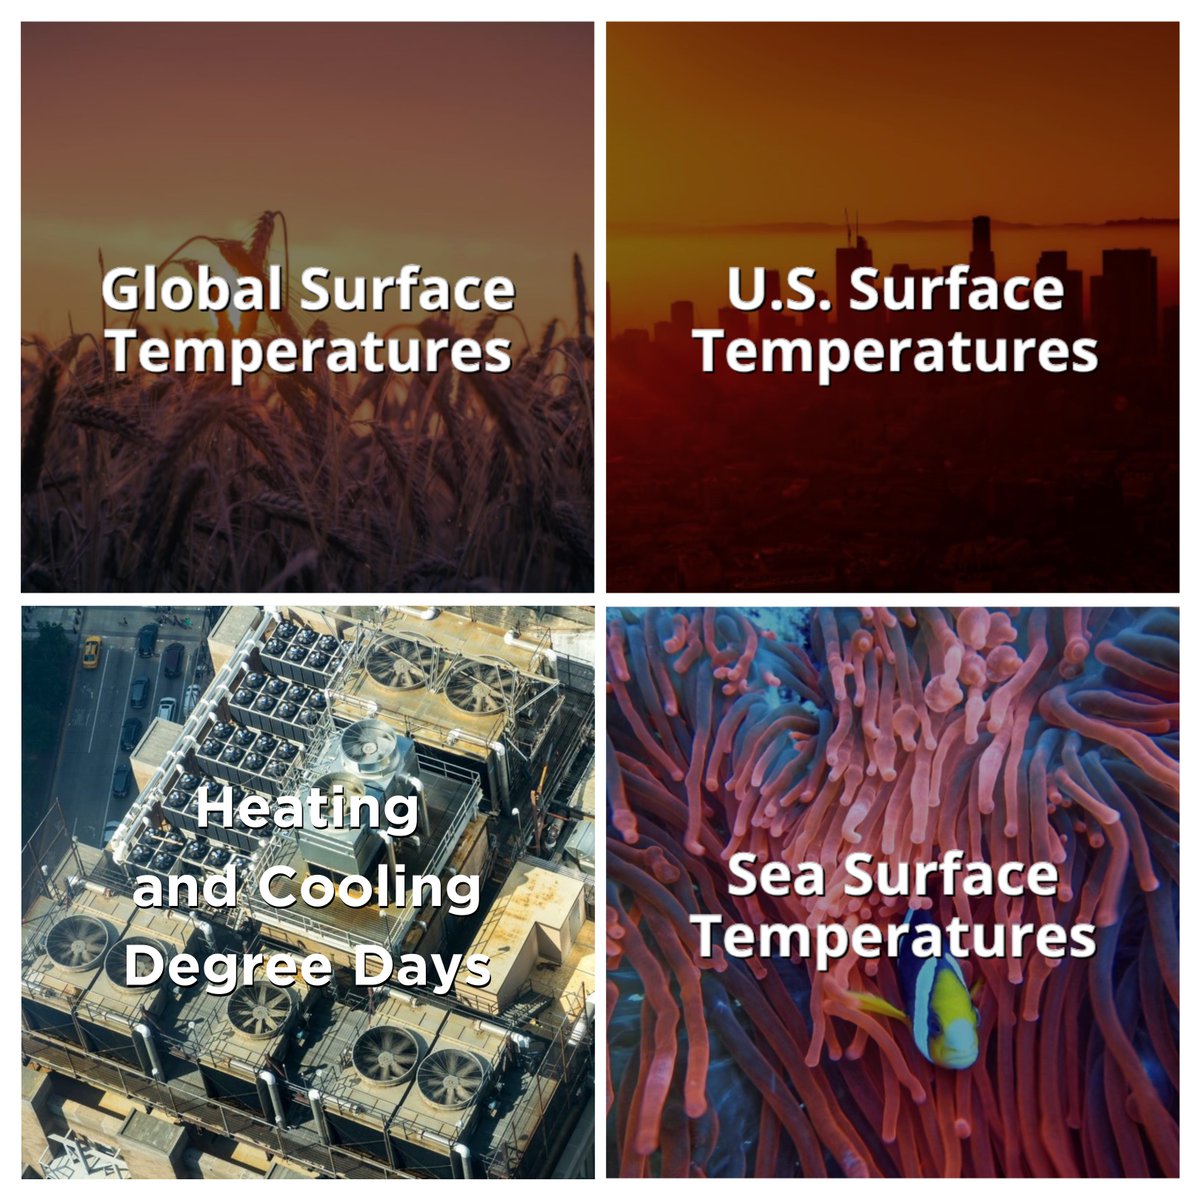
JUST IN: 4️⃣ #climate indicators from @USGCRP’s Indicator Platform have been updated with 2021 data:
🌎 Global Surface Temperatures;
❄️ Heating and Cooling Degree Days;
🌊 Sea Surface Temperatures;
🌡️ U.S. Surface Temperatures;
Explore our Platform: https://t.co/VhSZbsbY2O
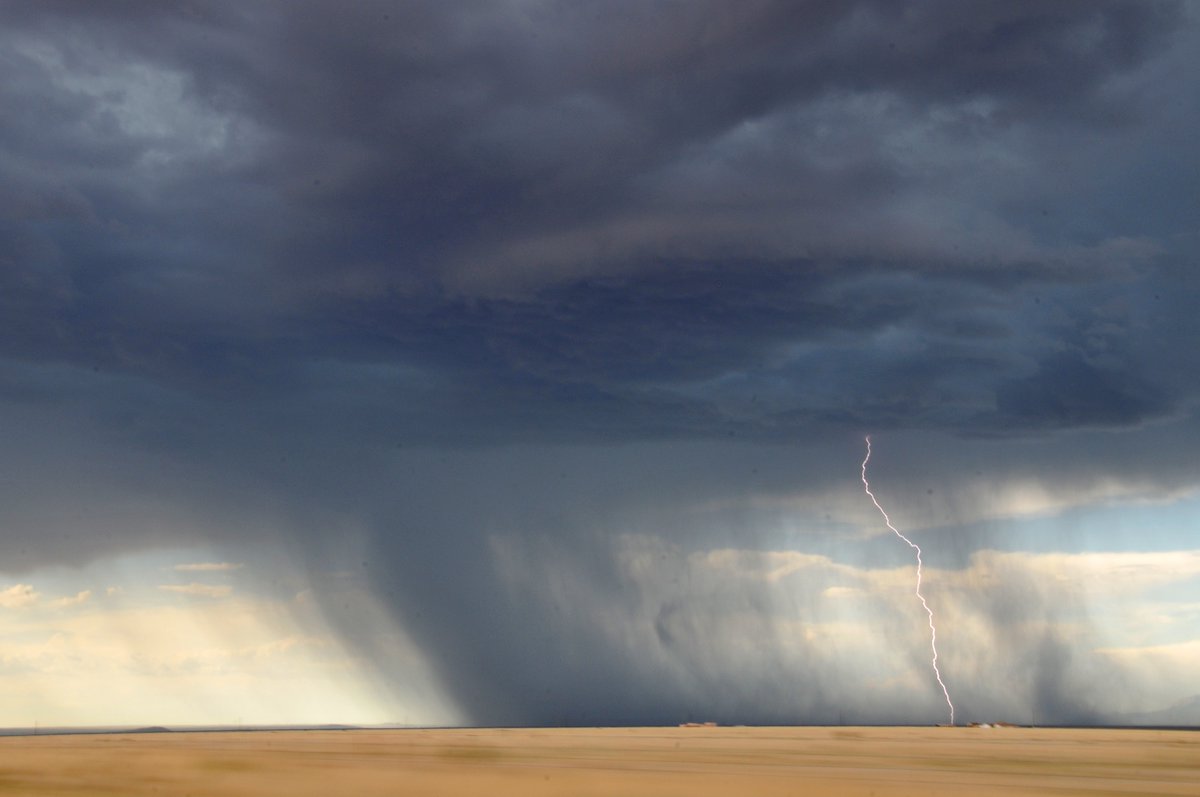
Climate change is driving increases in heavy precipitation across much of the US, and planners need better information about future precipitation events to develop resilient infrastructure. Researchers from NCICS and @NOAANCEI have developed a new tool to help meet that need.
@NOAA's 2022 Sea Level Rise Technical Report is out now! The report provides the most up-to-date #SeaLevelRise projections for all U.S. states and territories.
According to a new NOAA-led report, the U.S. is expected to experience as much #SeaLevelRise by the year 2050 as it witnessed in the past 100 years: https://t.co/7SqKaqZXRa @noaaocean
Looking to contribute to the next National Climate Assessment? Participate in our #NCA5 Public Engagement Workshops—three of which are happening today! See the full workshop schedule and register here: https://t.co/Zz2pZ2sP85
@ClimatoDan @NCState_NCICS@NOAANCEI@usgcrp That's great! Effective climate communication is key, so always good to hear when others are able to utilize our information in a meaningful way.
Hot off the press! NOAA's updated State Climate Summaries have just been released.
I'm proud to have worked on this project for the past year with some very talented colleagues at @NCState_NCICS, @NOAANCEI, and @usgcrp.
I recently worked with my friend, colleague, and tropical cyclone expert @carl_schreck to develop a new indicator showing changes in Atlantic tropical cyclone activity—a first for the @usgcrp Indicator Platform. Check it out!
🚨 New #climate#indicator just in! 🚨
Check out the Atlantic Tropical Cyclone Days indicator on our Indicator Platform, contributed by @NOAANCEI and @NCState_NCICS, with data from @NHC_Atlantic:
https://t.co/a3iBC8XEcX
Interested to learn about #climatechange and the human environment? Our review paper focuses on #NCA4 findings related to #AirQuality, forest disturbance and #wildfire, energy systems, and water resources. https://t.co/2HPSbnSJ3H
@USGCRP maintains a suite of climate change indicators which are updated on an annual basis. Learn about one of those that tracks how the warming influence of greenhouse gases is changing over time.
The warming influence of greenhouse gases (GHGs) in the atmosphere—the cause of global warming today—has increased substantially over the last several decades. But how is this measured, and who does the measuring? 1/3 #climatechange#GHG
There are many indicators of our changing climate, including temperature of course. I work with @usgcrp to update these each year - go check out the latest data here (spoiler alert: it's getting warmer).
Let’s talk temperature! ☀ Did you know many decades of data from all around the world support our understanding of Earth’s climate? The @USGCRP streamlined catalog covers the basics: https://t.co/072HoqUoyf @NCState_NCICS#GlobalChange