A framework to get you to a 50-100 bagger stock.
What it takes:
1. Small/Mid starting market cap - so that there is enough scope for the market cap to expand.
2. Institution worthy but under-owned by institutions - Secular multi year growth catalyst + scope for persistent buying over months and years
3. Neglect (during hold period) - not a mainstream idea - often they don't believe in it till the last one-third phase - ability to hold against consensus is the edge
4. Long Holding period - huge gains are made only if you’re willing to hold the positions for years and decades and have an aversion to selling or booking profits.
5. Drawdown - methodology to ignore 50-90% drawdowns. I don’t say ability to stomach as one can’t really stomach it. It essentially comes down to not even looking at it or avoiding calculating your returns or drawdowns. Vision helps (covered below).
6. Allocation - Just the right starting allocation (typically small enough) that you never feel the pinch even if it goes wrong and you can continue to hold on for as long as it takes
7. Vision - to see the big picture and the larger trend and not be bothered by events in the interim.
This in no way means one should follow this approach - there are many ways to make it work in the markets - but just to understand that this is what it takes.
You don't need to read 100s Investor Presentations and annual reports
You need to ingest them with NotebookLM, then research with Claude.
Here are 8 powerful prompts that compress 200 hours of investing research into one weekend break.
Save this thread 🧵
10 Mental Models that will help you to make better decisions
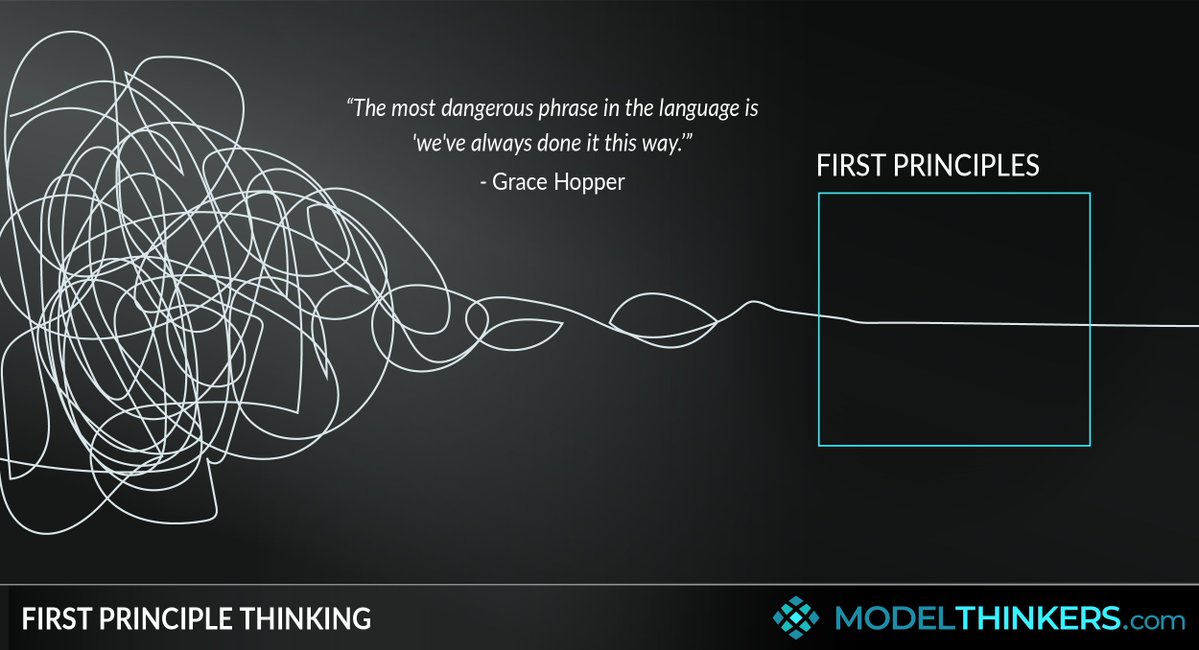
1. First Principle Thinking
Rethink problems from the ground up by separating underlying facts from assumptions.
In 2019, MIT professor Patrick Winston gave a legendary 1-hour lecture called “How to Speak.”
It has 18M+ views for a reason.
His frameworks:
• Your ideas are like your children
• The 5-minute rule for job talks
• Why jokes fail at the start
15 lessons on communication:
Introducing: Curiosity Stack
A structured research thinking tool for Claude Cowork. Decode any technology or market signal into 2nd and 3rd order business insights.
--> Decompose any industry, business or a topic
--> 6 layers to take your through each step
--> Just tell it what you want to decode & tool will handhold you at each step, interactive, asking questions at each step to make it immersive
--> Connect 17 diff sources to bring your own notes, information, context in the discussion
--> Discover global or Indian proxies to a given industry or just ask it break down a hyper around any topic
--> Do thesis stress test, 5 curated reading recommendations targeted at the specific topic and layers explored
--> Persistent memory across the sessions
--> Generate Value Chain diagrams, Interactive Mind-Maps
--> If you discover a business in your interested domain but that not listed, setup an alert of your choice, for e.g., alert me when the company files DRHP.
--> Export entire discussion into research note
If you ever struggled with a topic or domain and didn't know where to start, this might help.
Note: You must be CoWork user. The plugin is currently under review with Anthropic. If you prefer to wait and try only after it is approved, for security reasons, please be patient.
Detailed note here: https://t.co/GUQHH6Tln2
R.I.P. basic prompting.
MIT just dropped a technique that makes ChatGPT reason like a team of experts instead of one overconfident intern.
It’s called “Recursive Meta-Cognition” and it outperforms standard prompts by 110%.
Here’s the prompt (and why this changes everything) 👇
@abhymurarka Also look at Nasscom deeptech club. At least 4-5 companies from this list will come for an IPO in next 2-3 yrs. And more than half have done some fund raise, others will do very soon. https://t.co/ZhRhau4DVp
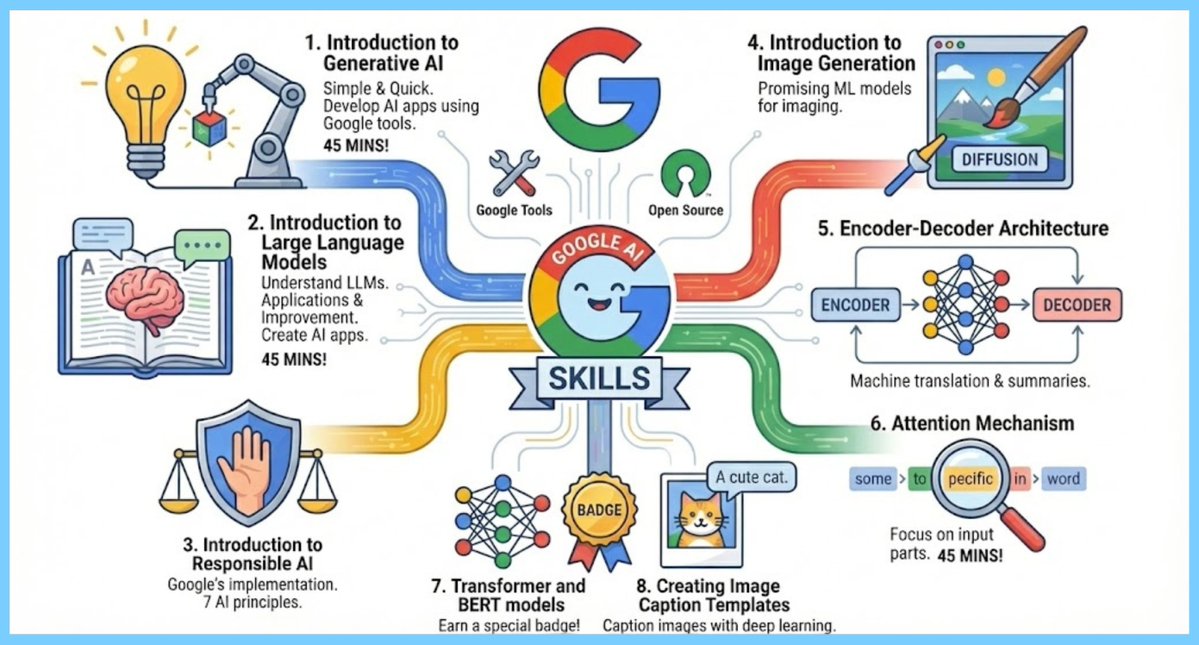
I still can’t believe this is free.
Most universities are charging tuition to teach theoretical AI.
Meanwhile, Google is giving away practical, state-of-the-art training for $0.
Some courses take just 45 minutes. ⏱️
• Generative AI & LLMs? ✅ • Diffusion & Image Generation? ✅ • Transformers & BERT? ✅ • Earn a Badge? ✅
Here are 8 free courses you can start today (plus many more available on the platform):
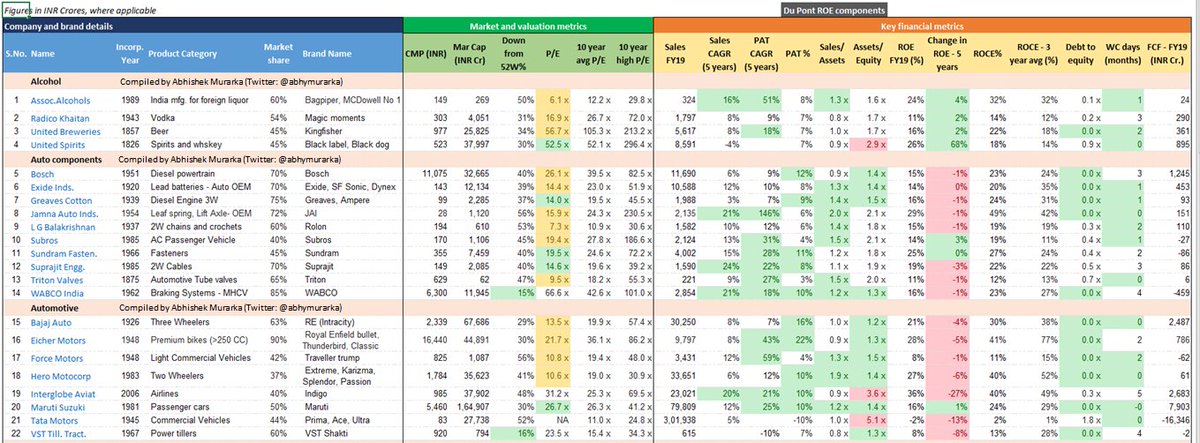
One key learning from 2008 crisis is that good companies came out stronger at the end of it.
With this objective, have compiled financial and market data of 62 market leaders (>30% market share in resp. industries) for analysis. Sharing in thread.
Part 1 - Auto+anc. & alcohol
10 Vital Things To Check Before Investing In Any Business Or Stock
Here’s a practical checklist to level up your stock selection process-
1) Past Revenue Growth
Check revenue growth over the last 3–5 years. Double-digit CAGR is preferred.
For cyclical companies — study how they perform in upcycles and downcycles. Studying old cycles can give you a clue about how future ones might play out.
2) Competitive Intensity
How many players are there in the industry? The lesser the better. If there are a lot of players, check if everyone makes money or not? Competitive intensity matters a lot. Also check if the business you are studying has something unique like — cost advantage, brand, distribution, etc.
3) Consistency Of Margins
Are the margins volatile or consistent? Check the margins of the last 10 years. If current margins are unusually high, don’t overpay. Margins eventually revert. Buy when they’re expanding — not peaking.
4) Operating Leverage
Look for companies where fixed costs are done & sales are now scaling. Capex cycles and management commentary will help you to spot this. Getting this right can lead to powerful re-ratings.
5) Check The Cash Flows
Is the company able to convert its EBITDA into cash flows? Some companies have epic income statements and profits. However, when you look at their cash flows, everything is stuck in the working capital. This is an important question to ask when looking at stocks.
6) Market Penetration
How much headroom is left to grow? If a product has >90% market penetration, growth might be limited. But companies creating new categories can grow exponentially.
7) Focus On Volume Growth
Revenue = Price × Volume
The best quality of growth is when the number of units sold or volumes sold keeps going up. Double digit volume growth over an extended period of time can lead to big winners in the stock market.
8) B2C > B2B > B2G
Generally B2C valuations are > B2B Valuations > B2G Valuations. Thus, if you see consumption businesses growing at double digits, do not ignore them!
9) Margin Of Safety
Have a Margin Of Safety or be cautious of the valuations you are paying for a stock. You can be right on all the things but one can forget that sometimes accidents happen. At high prices, small mistakes might lead to derating of PE Ratio. A great business bought at the wrong price may prove to be a bad investment.
10) Learn Stage Analysis
Learning Stage Analysis is a blessing for fundamental investors who are good at valuing companies. It will help you to understand where the stock is in its cycle.
Few books which can help you to understand the cycle of a stock from fundamental and technical perspective- 1) Understanding Michael Porter by Joan Magretta, 2) Capital Returns by Edward Chancellor and 3) Secrets For Profiting In Bull and Bear Markets from Stan Weinstein.
Hope this post gave you a rough checklist to evaluate stocks better!
My college principal has no idea that his daughter is my girlfriend, but today fate decided to speedrun my funeral.
We were peacefully eating ice cream, minding our own business, when suddenly the principal, his wife, AND his son walked into the same ice cream parlor.
Bro, why was his whole family tree there? Did the universe schedule an intervention for me?
Me standing there like, “Yep, this is where my academic career, relationship, and soul all get rejected in one go.”
The principal starts interrogating me:
- Why are you here?
- Give your father's phone number
- When will you pay the college fee?
But then his wife saved us – she's my math professor!
But his 11-year-old son was judging me harder than my GPA.
All three of them had completely different personalities:
- Principal: strict and outdated
- Wife: modern and chill
- Son: judgmental
Honestly, the amount of difference between these three people needs an ANOVA test.
ANOVA is nothing but a statistical way to compare the means of three or more groups to determine if there's a significant difference between them.
Formula:
F = MSB / MSW
MSB = SSB / (k − 1)
MSW = SSW / (N − k)
SSB = Σ n (x̄ᵢ − GM)²
SSW = Σ (n − 1) sᵢ²
Where:
- F: F-statistic
- MSB: Mean Square Between groups
- MSW: Mean Square Within groups
- SSB: Sum of Squares b/w groups
- SSW: Sum of Squares Within groups
- k: Number of groups
- N: Total number of observations
MSB tells us how much the group means vary from the overall mean.
MSW tells us how much individual values vary within each group.
If F is big → Differences are too large to be random
If F is small → Differences could just be noise
Let's take an example:
A chips company claims their new flavor tastes better than tomato flavor and onion flavor.
They test 30 customers with tomato flavor (avg. rating: 7.2), 30 customers with onion flavor (avg. rating: 6.9) and 30 customers with the new flavor (avg. rating: 8.1). Standard deviations are 1.5, 1.0, and 1.3 respectively.
Sample sizes
- n₁ = 30
- n₂ = 30
- n₃ = 30
Sample means
- x̄₁ = 7.2
- x̄₂ = 6.9
- x̄₃ = 8.1
Standard deviations
- s₁ = 1.5
- s₂ = 1.0
- s₃ = 1.3
Question: Do the data show a statistically significant difference in mean ratings?
Let's solve step by step:
Step 1: Hypotheses
H₀: All means are equal
H₁: At least one mean is different
Step 2: Calculate Grand Mean (GM)
- x̄₁ = 7.2
- x̄₂ = 6.9
- x̄₃ = 8.1
- GM = (7.2 + 6.9 + 8.1) / 3
- GM = 7.4
Step 3: Calculate SSB
SSB = Σ n (x̄ᵢ − GM)²
+ 30(7.2 − 7.4)²
+ 30(6.9 − 7.4)²
+ 30(8.1 − 7.4)²
SSB = 23.40
Step 4: Calculate SSW
- SSW = Σ (n − 1) sᵢ²
- 29(1.5)² + 29(1.0)² + 29(1.3)²
- 143.26
Step 5: Calculate MSB and MSW
- k = 3, N = 90
- MSB = SSB / (k − 1)
- 23.40 / 2
- 11.70
- MSW = SSW / (N − k)
- 143.26 / 87
- 1.6467
Step 6: Calculate F-statistic
- F = MSB / MSW
- 11.70 / 1.6467
- 7.11
Step 7: Calculate Degrees of freedom
- df₁ = k − 1 = 2
- df₂ = N − k = 87
Step 8: Determine Critical Value
- Search F-Table on Google
- and check critical value for
- α = 0.05, df₁ = 2, df₂ = 87
According to the F-table, critical value is 3.10
Step 9: Decision
Since F = 7.11 > 3.10, reject H₀.
Final Answer:
Yes, there is a statistically significant difference in mean ratings among the three flavors (the new flavor differs from at least one of the others).
Congratulations 🎉, you've just learned ANOVA!
Bonus: Applications of ANOVA in Real Life & AI/ML
1. Manufacturing Quality Control: Companies use ANOVA to compare product quality from different production lines or machines to identify which ones need maintenance.
2. Marketing & A/B Testing: ANOVA helps compare effectiveness of multiple marketing campaigns, ad designs, or pricing strategies simultaneously.
3. ML Model Selection: Data scientists use ANOVA to compare performance of multiple machine learning models across different datasets to find the best one.
[1/10]
Shaily Engineering Plastics | NSE: SHAILY | BSE: 501423 | Rs 2,575
The GLP-1 Transformation Accelerates
Healthcare revenue surged 163% YoY to Rs 98.6 crores, doubling its contribution to 38% of total revenue. Margins expanded dramatically by 1,000 bps to 31.8%. Capacity expansion from 40 million to 80 million pens by FY26-end is now underway.
The company is India's largest exporter of plastics components, positioning itself as a key player in the global diabetes care revolution.
🚗 Remsons Industries – a 50-year-old Indian auto-parts maker reinventing itself for the EV era. This small-cap has bagged big orders (Tata Motors, Stellantis) and aims to triple revenue by FY29. Can it shift into the big league? Let’s dive in 🧵👇









![thevicky_roy's tweet photo. [1/10]
Shaily Engineering Plastics | NSE: SHAILY | BSE: 501423 | Rs 2,575
The GLP-1 Transformation Accelerates
Healthcare revenue surged 163% YoY to Rs 98.6 crores, doubling its contribution to 38% of total revenue. Margins expanded dramatically by 1,000 bps to 31.8%. Capacity expansion from 40 million to 80 million pens by FY26-end is now underway.
The company is India's largest exporter of plastics components, positioning itself as a key player in the global diabetes care revolution.](https://pbs.twimg.com/media/G54F9wUagAE_iH8.jpg)


