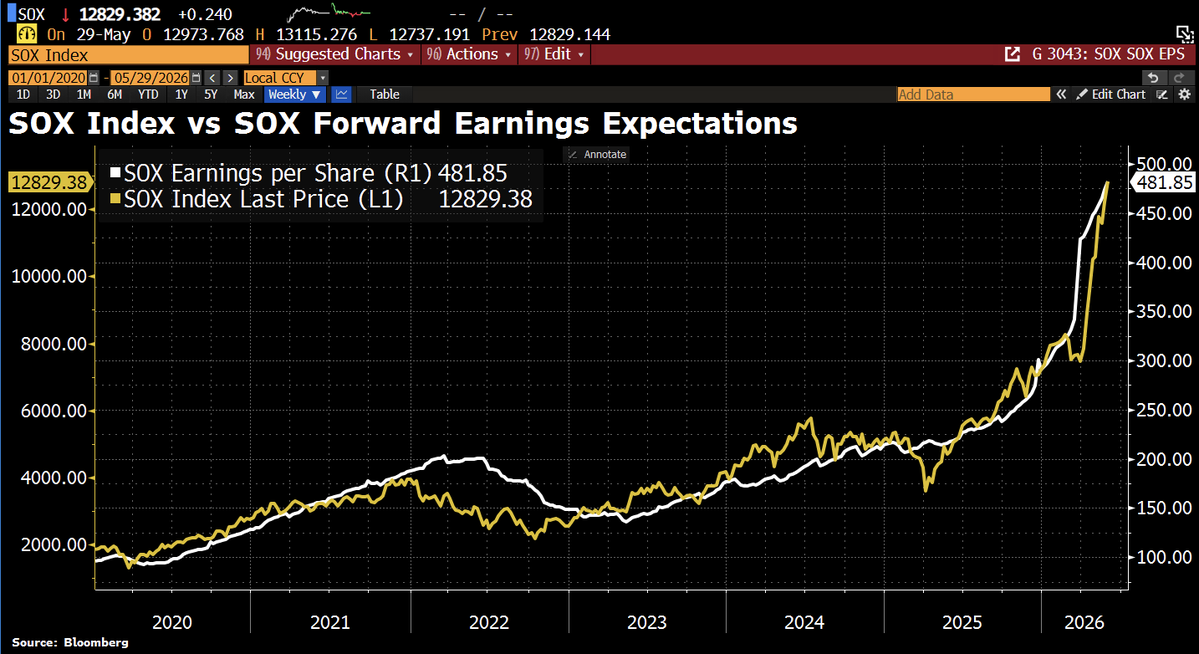
One of the most striking charts out there: the SOX index has risen sixfold since 2020, while SOX earnings per share have climbed fivefold. In other words, most of the rally has been backed by real earnings growth, not just higher valuations. The key question now is whether these profits will actually come through and whether they can keep rising. (HT Goldman Sachs)
Are investors finally stepping back into individual stocks? The volume data says yes.
• Risk-On Alert: The S&P 500 Liquidity Premium indicator has officially triggered a risk-on signal, marking a shift from broad market uncertainty to confident participation.
• The Mechanism: This indicator measures the volume of the SPY ETF versus its underlying stocks. A drop in the indicator means volume is flowing back into individual names—a classic sign of returning confidence.
• The Edge: When the indicator's 84-day range rank cycles from extreme uncertainty (>99%) down to returning confidence (<42%) while the S&P 500 is in a long-term uptrend, historical forward returns for the SPY are exceptionally strong.
While uncertainty recently drove traders into the safety of the broader SPY ETF, the volume is decisively shifting back to underlying stocks. History shows this specific sentiment reversal is a powerful bullish tailwind for the market.
Read Full Analysis: https://t.co/b5EidO7ZgA
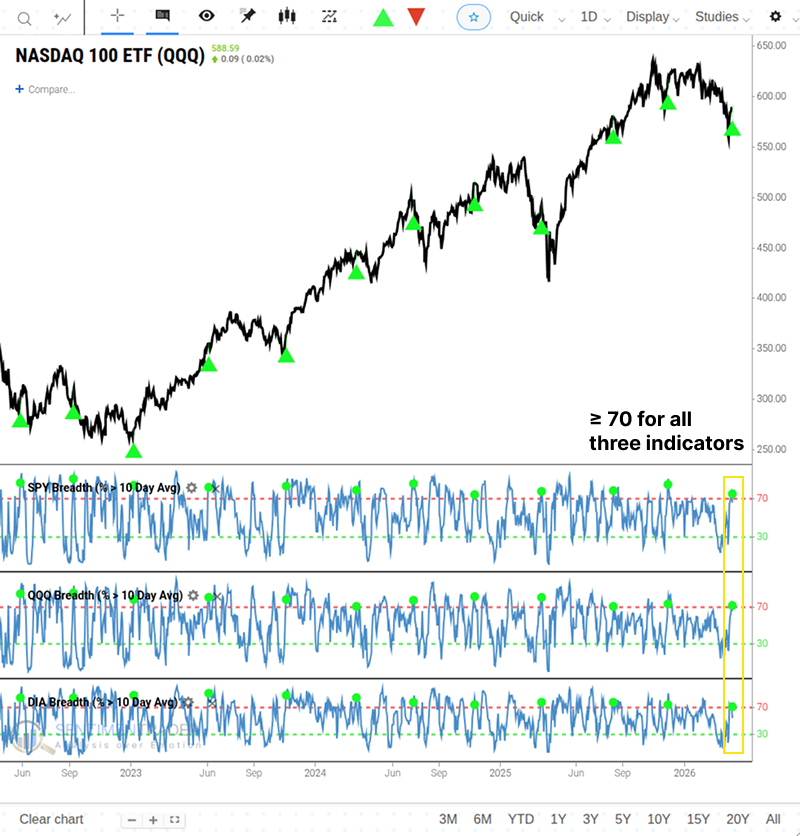
As shown in our chart, short-term breadth has cleared the critical 70 threshold across $SPY, $QQQ, and $DIA at the same time. Historically, this kind of synchronized thrust has tended to support a stronger underlying trend.
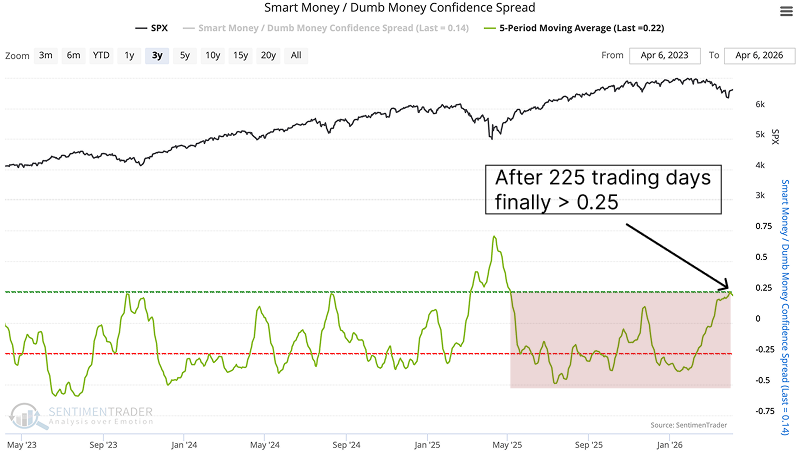
The Smart Money / Dumb Money confidence spread crossed above 0.25 after a 225-day suppression period.
Only 7 prior signals have occurred, each followed by positive returns over the next year.
Read Full Analysis: https://t.co/iJUI9CJyKS
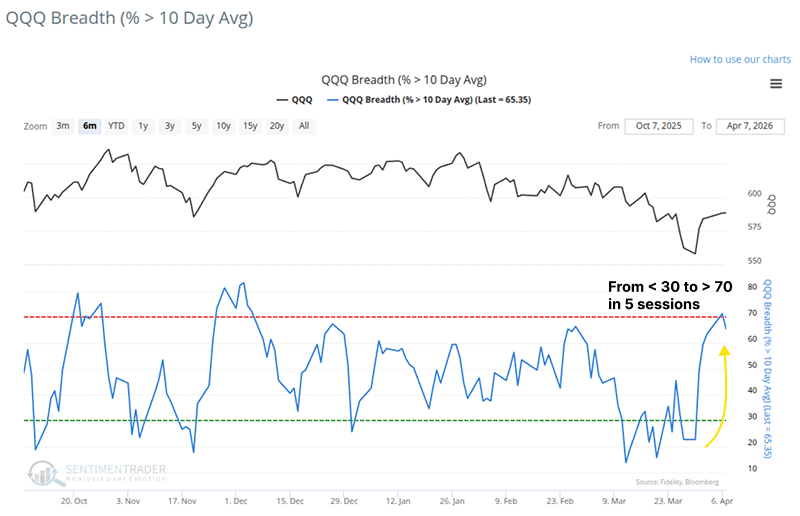
Are we witnessing the end of the Nasdaq's correction?
• Rapid Thrust: QQQ short-term breadth (percentage of stocks > 10-day MA) just violently surged from under 30% to over 70% in only five sessions.
• The Edge: Historically, this exact momentum reversal yields a massive 80% win rate for the Nasdaq 100 over a one-year timeframe.
• Broad Confirmation: This isn't just a tech bounce. Short-term breadth across the S&P 500 and Dow has also expanded past the critical 70 threshold, confirming a broader "Risk-On" environment.
The sudden, synchronized breadth expansion historically signals that the worst of the correction is over and a sustained rally is highly probable.
Read Full Analysis: https://t.co/b5EidO7rr2
@SH_Polizei Schon interessant, dass sich der Großteil hier in den Kommentaren an dem Wort "Verkehrsteilnehmende" aufhängt, anstatt über die Tat und das Geschehen an sich. Kann das in Teilen auch durchaus nachvollziehen, dennoch ist hier der Fokus aufs Wesentliche ggf. etwas verschoben...
Hedge Fund Selling Shows Signs of Capitulation
From GS via BBG:
- “Some signs of capitulation are starting to emerge”
- Funds cut global equities for a 6th straight week
- Europe macro product shorts are at a 10-year high
- CHART: US selling hit the *3rd-largest* in a decade:
This is where the market can usually fools the most people.
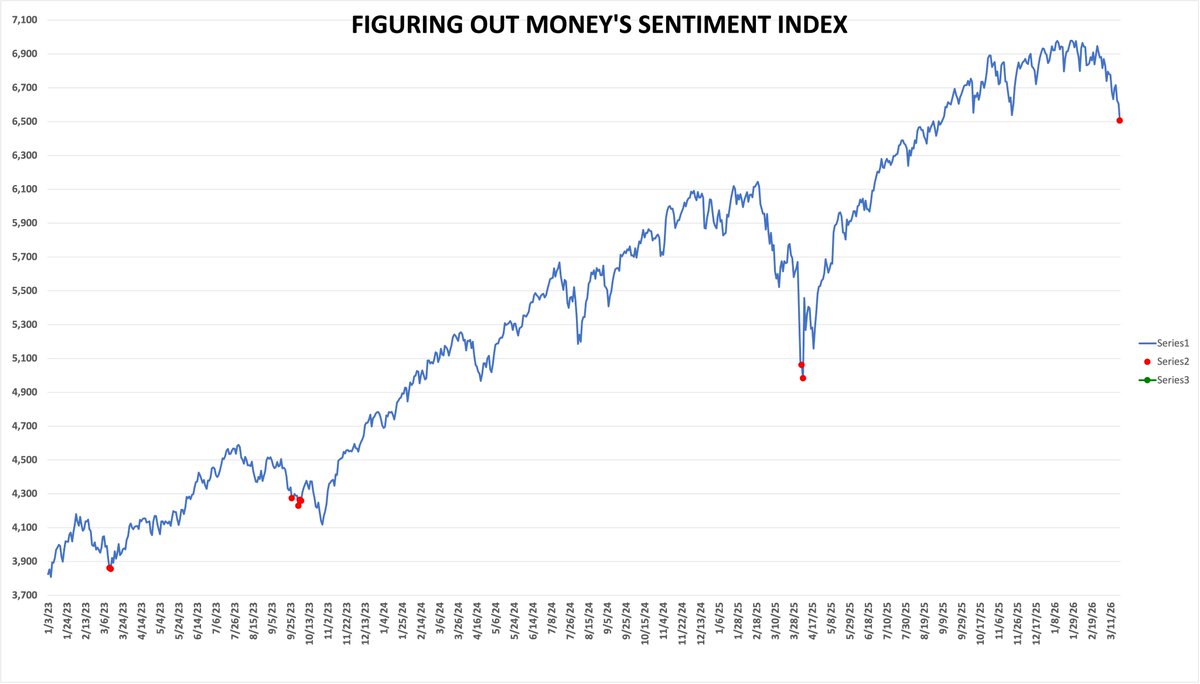
My sentiment index just printed 9.5. That's the lowest reading since the April 2025 bottom when it hit 6.5.
Every red dot on this S&P chart marks a reading below 9.6. Look where they land. Every single one caught a major low.
If you're very bearish right here, just know that some of the most violent face-ripper rallies happen in bear markets. That's not a bug, that's the feature. The crowd gets max bearish right before the snapback burns them.
Not calling the bottom. Just saying readings like this have a way of making the bears pay just as much as the bulls.
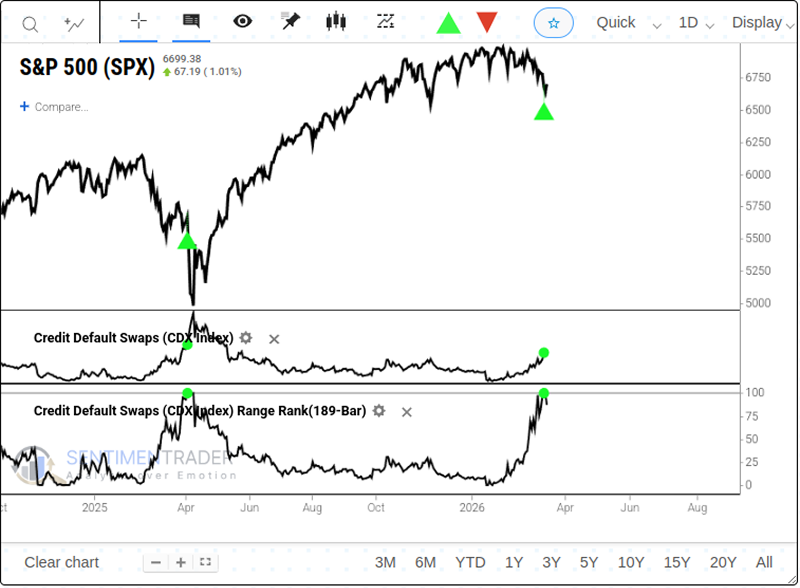
Does a spike in bond default protection signal equity market headwinds?
• CDS Signal: Bond default insurance prices jump to a 9-month high (100% of its 189-day range)
• Broad Market: S&P 500 posts 46% win rate and negative median return 2 months after the signal
• Sector Impact: Financials (XLF) see 50% 1-year win rate, with average max loss double the average gain
• Defensive Exception: Only utilities sector shows outperformance post-signal
This credit stress signal highlights rising default worries, with acute downside risks for financials and a cautionary tone for broad U.S. equities.
Read Full Analysis: https://t.co/b5EidO7rr2
This is where the market usually fools the most people.
Price looks heavy, breadth has been getting washed out, and everyone’s braced for more downside… But the Nasdaq bullish percent index and RSI are quietly putting in a bullish divergence. The Index makes a lower low while the RSI doesn’t.
That combo often shows up near turning spots can start, not where more selling begin.
Not a guarantee, just the kind of signal I watch when the crowd is leaning one way.
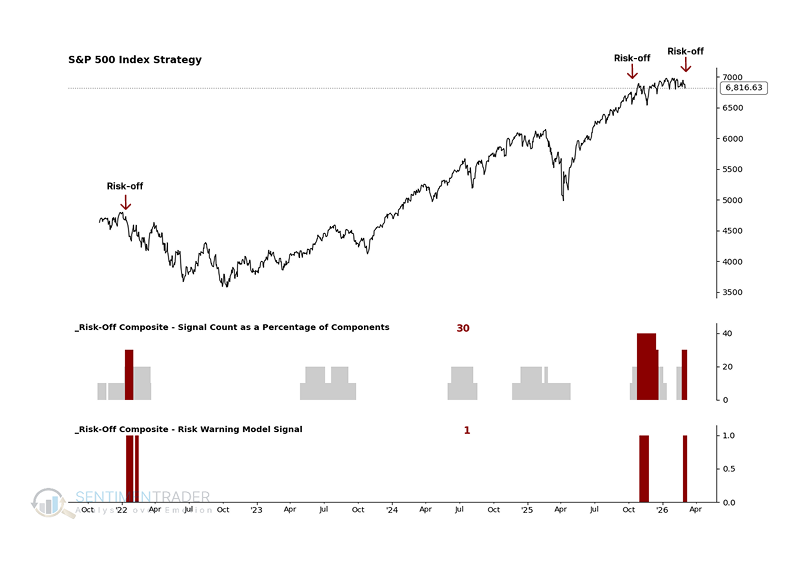
Is it time to play defense with your portfolio?
• Risk Warning: The S-TCTM Risk-Warning Model officially triggered a risk-off signal—only its 17th alert since 1979
• The Threat: Historically, this signal precedes weak win rates and heavily skewed downside risk for the S&P 500 across most timeframes
• The Playbook: Cyclical sectors typically underperform in this environment, making a rotation into defensive positioning the priority
When market internals weaken, the historical precedent demands caution. Capital preservation and defensive rotation should temporarily take priority over aggressive risk-taking.
Read Full Analysis: https://t.co/b5EidO7rr2
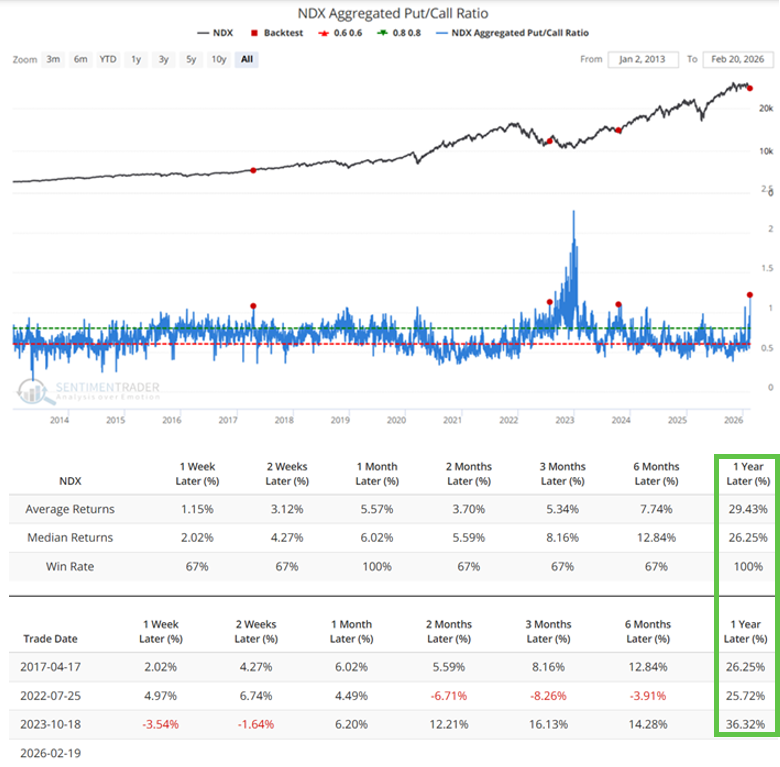
NDX Aggregated Put/Call Ratio>1.07 1sttime in 12 months. The sample size is microscopic, so NO, this is NOT a “Buy” signal. BUT, it does suggest A LOT of bearishness out there. Make of it what you will. @sentimentrader
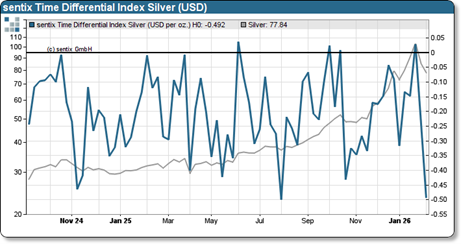
#Silver: Buy signal in the TD Index
The correction in precious metals was brief and sharp, but at the same time it was like a cleansing storm. There was a very rapid and dynamic adjustment in investor behaviour: The outlook for gold, silver and gold mining stocks is now looking good again. #sentix More #sentiment at https://t.co/FWsoCTB1Yq