Since most of my timeline is just predications and shit-posting...
I wanted to give you a valuable process you can use for days like Friday
Post Sell-Off Market Reset Plan:
A large down day often changes the market's character.
Breakouts fail, leadership rotates, support levels break, and many charts that looked attractive a few days ago are no longer actionable.
The goal after a large market sell-off is not to immediately find new trades.
The goal is to identify what held up best, remove what is no longer working, and rebuild a watchlist around the new leaders.
Step 1: Accept That the Market Has Changed
After a significant down day, assume that some of your previous watchlist is no longer relevant.
Many stocks will:
-Break key moving averages
-Lose momentum
-Trigger stops
-Require weeks to rebuild proper bases
Avoid forcing old ideas simply because they were on your watchlist before the sell-off.
The market does not care about yesterday's focus list.
Step 2: Clear Out Weak Charts
Review every stock on your watchlist and ask:
-Did it break key support?
-Did it lose the key moving averages?
-Did volume expand on the breakdown?
-Is the chart now damaged?
If the answer is yes, remove it.
A smaller list of quality setups is more valuable than a large list filled with broken charts.
Step 3: Scan for Relative Strength
The most important task after a large down day is finding stocks that resisted the decline.
Look for names that:
-Held up well relative to market weakness
-Closed near the middle of the candle range
-Held above key moving averages
-Refused to break support
These stocks often become future leaders once the market stabilizes.
When institutions continue buying during market weakness, that information matters.
Step 4: Re-Evaluate Themes and Sectors
Leadership often changes after corrections.
Ask:
-Which sectors held up best?
-Which themes continue attracting volume?
-Where is money flowing despite market weakness?
Focus on the strongest sectors first, then identify the strongest stocks within those sectors.
Strong themes produce strong leaders.
Step 5: Build a Fresh Watchlist
Create three categories:
Tier 1 – Relative Strength Leaders
Stocks that held up exceptionally well during the sell-off.
Tier 2 – High Quality Pullbacks
Strong trends that experienced healthy pullbacks into support.
Tier 3 – Rebuild Candidates
Stocks that were damaged but may become actionable again after forming new bases.
Prioritize Tier 1 names.
Step 6: Let the Market Prove Itself
Do not assume the first bounce is the bottom.
Allow:
-Support levels to hold
-Breakouts to follow through
-Volume to confirm
-Market indexes to stabilize
The best opportunities usually appear after the initial panic, not during it.
Step 7: Reduce Aggression Until Conditions Improve
After a large sell-off:
-Trade smaller
-Be more selective
-Demand stronger confirmation
-Focus on execution over P&L
Market conditions determine aggressiveness.
When conditions improve, exposure can increase naturally.
Key Question Every Night
Instead of asking:
"What can I buy tomorrow?"
Ask:
"What stocks are proving they deserve a spot on my watchlist?"
The stocks that continue showing relative strength during market weakness are often the same stocks that lead the next advance.
Trading earnings gappers and Relative Strength (RS) names is a staple strategy for momentum market participants. Combining these two concepts allows you to focus strictly on the fastest-moving, highest-octane equities in the market.
Here is a breakdown of the primary structural, psychological, and technical advantages of focusing on these setups:
1. Institutional Footprints and "True" Market Demand
When a stock gaps up significantly on earnings, it’s rarely retail investors driving the move. It is almost always institutional accumulation (mutual funds, hedge funds, and pension funds) readjusting their positions based on new structural data.
The "Beat and Raise" Catalyst: A gap is the market's violent repricing mechanism to a "beat and raise" report. Because institutions take days, weeks, or even months to build full positions without spiking the price too high, an initial earnings gap often marks the *beginning* of a longer-term structural advance rather than the end.
Liquidity Influx: These events act as liquidity magnets. High volume allows you to enter and exit size easily without experiencing devastating slippage.
2. Efficiency of Capital (The Velocity of Money)
Trading high RS names means you are consciously avoiding laggards, bottom-fishers, and dead money.
Outperformance in All Market Environments: True RS names hold up remarkably well when the broader indexes ($SPY / $QQQ) are choppy or pulling back. When the market finally turns corner or finds a bottom, these leading names are typically the first to break out to new highs.
Instant Gratification (Reduced Opportunity Cost): By buying stocks that are already in strong, established uptrends and validating them via fresh earnings catalysts, you minimize the time capital spends sitting idle waiting for a thesis to develop.
3. Clear Technical Guardrails and Risk Management
One of the biggest misconceptions about trading gappers is that it is "chasing" and inherently high-risk. In reality, these setups offer exceptionally clean risk parameters:
The Gap as Support: The low of the post-earnings gap-up day creates a structural line in the sand. If the stock holds above the gap low (or the opening print), it proves the institutional demand is real.
Moving Average Confluence: High RS names tend to respect short-term momentum moving averages beautifully. Leading stocks often track right above their rising 8week (EMA)on the weekly chart or the 10-day/21-day EMAs on the daily chart. These provide unambiguous, objective trailing stop locations.
Clean Consolidation Patterns: Following an explosive earnings gap, high RS stocks frequently form predictable, high-probability continuation patterns like High Tight Flags (HTFs) or low-cheats, giving you distinct, low-risk cheat entries before the next leg up.
4. Psychological Edge and Structural Bias
Short-Seller Fuel: High RS stocks gapping to new highs often have a contingent of traders trying to top-pick them or short the valuation. When the company delivers a blowout report and guidance, those shorts are forced to cover, creating a secondary buying wave that accelerates the upward momentum.
* Eliminating Analysis Paralysis: The stock market has thousands of listings. Filtering exclusively for the highest-relative-strength names that have just reported an earnings catalyst shrinks your watch list down to a hyper-focused elite group. You are only looking at the best of the best.
The Core Takeaway: Trading earnings gappers combined with elite RS shifts the mathematical expectancy in your favor. It ensures you are aligned with institutional pockets, focused on sectors with secular tailwinds, and trading names where the path of least resistance is structurally skewed to the upside.
Elite Trading Framework (Structural Momentum & HVE Systems)
This master blueprint outlines my execution ready trading methodology. It is engineered to capture explosive moves in high velocity growth stocks by combining supreme institutional urgency, structural price compression, and flawless mathematical risk management relying strictly on clean daily and weekly price action for entry and invalidation.
Strategy 1: The Core Structural Swing System
This strategy focuses on trading elite relative strength and structural chart compression directly against key moving averages on the daily and weekly timeframes.
Phase 1: Screening & Selection
Elite Relative Strength (RS): You target market leaders actively outperforming the broader indexes ($SPY/$QQQ). You prioritize vehicles pushing into "blue sky" all-time high territory or tightly consolidating directly under lifetime resistance, proving they are immune to market selling pressure.
True Fundamental Engines: Setups must be backed by undeniable institutional drivers, such as recent "beat and raise" earnings reports or powerful secular trends (e.g., AI data center infrastructure and next-gen semiconductor components).
Phase 2: The Setup & Volatility Compression
You never buy extended, chasing stocks away from support. You patiently wait for the near term supply to dry up and the moving averages to catch up to the price.
High Tight Flags (HTFs): High velocity moves that flag sideways, refusing to retrace deeply, proving that institutions are aggressively defending the shares.
The "Squat" Pattern: The stock "squats down" tightly into its key dynamic moving averages using the 8w eek EMA on the weekly chart as your ultimate reference point for pullbacks to determine if it is ready to move immediately or needs more time, or the 21 EMA on the daily chart.
Inside Days & Volume Dry Up (VDU): You look for tight daily candles trading entirely within the prior day's range. As the stock sits in the squat, volume must completely disappear, proving that floating supply has been completely absorbed.
Phase 3: Absolute Daily Execution & Invalidation
The Trigger: Entry is executed on a clean breakout past the immediate daily consolidation pivot level (e.g., the high of the inside day, the high of the flag, or down-trend resistance).
The Stop Loss: Your risk is pegged strictly and mathematically to the structural low of the consolidation setup typically placed right under the low of the "squat" candle, the inside day low, or the key supporting 8 week EMA. If the stock triggers the breakout but immediately reverses through this low, the squat isn't ready. You cut the trade instantly with zero hesitation.
Strategy 2: The HVE (Highest Volume Ever) Breakout Strategy
This is your specialized, ultra high conviction strategy reserved exclusively for historic corporate milestones and absolute institutional urgency.
The Setup: You scan for a stock printing its Highest Volume Ever Traded, typically accompanied by a massive, violent gap up or breakout past all time highs or out of a multi month institutional base.
The Psychology: This represents a permanent structural regime shift. Massive mutual funds and institutions are trapped in a state of extreme urgency, scrambling to build positions all at once. This historic volume signature permanently changes the character of the stock.
Execution & The First Pullback: * Day of Print Entry: Entering directly on the breakout daily candle if it clears a clean key level with a defined structural daily low stop.
The First Pullback (The High Probability Play): If the initial HVE gap is too extended to manage risk safely on a daily chart, you place the ticker on a high priority watchlist. You wait to buy the very first orderly pullback or "squat" back to a key technical level or the 8-week EMA, knowing institutions will heavily step in to defend the baseline of the highest volume day in the company's history.
System Mathematics: Asymmetric Expectancy
The ultimate engine of both strategies is pure mathematical expectancy. Because you buy right at the exact inflection point of a tight daily/weekly flag or a structural squat, your risk from entry to your daily stop loss is remarkably small (frequently only 1% to 3%).
The Reward: When a high RS leader or an HVE catalyst stock successfully clears its daily pivot and unlocks its next major momentum expansion leg, it can easily surge 10% to 15% or more in a matter of days.
The Ratio: This creates a clean 1:5 risk to reward ratio (risking $1 to make $5).
The Expectancy: Under this mathematical profile, you do not need a high win rate to compound capital rapidly. Even with a modest 25% to 30% win rate, your outsized winners will heavily multiply your small, tightly controlled losses, guaranteeing consistent, geometric account growth over a large sample size of trades.
Waiting for THE Pullback
“Far more money has been lost by investors preparing for corrections, or trying to anticipate corrections, than has been lost in corrections themselves.” ~ Peter Lynch
I am still reposting the same quote and same post. Why, because nothing changed.
There will always be people who doubt the V-shape recovery and attempt to call the top at every stage along the way up. The market can do what it wants to do in the short term, maybe it will give you that healthy PB as you wish, maybe it won't.
My humble advices:
1) Zoom out
Have a macro view, e.g. what's the best strategy in a bull market?
Primary Trend > bearish patterns.
2) PB is normal
You can't expect price to go up forever, but do not expect PB to always happen when you wish for it, or to the extent which you wish for.
3) Stocks > Index
I don't trade the index which is a basket of stocks, I trade the leaders.
4) Rotation is normal
Funds won't buy the same stock every day and push it up every day. If they do it this way, it is actually not to their benefit.
Some leaders also now dance to their own drums.
5) Trade What You See
A simple and old saying, yet not many actually practise it.
Or different people ended up seeing different things - some simply cannot escape from their personal bias, no matter how objective they pretend to be.
Don't overthink and complicate things.
6) Each time is unique
If you attempt to overthink and infer things according to your experience or observations, beware. Things could be deeper than what you could see, not many are Sherlock Holmes and can successfully piece them together.
7) Fix Up Your Process
If you are still struggling in these recent few months when the index is up, you probably got the timing wrong or got the names wrong. Find out why.
8) Buy right and sit tight
Buy right and sit tight as long as the trend is intact. That's what trend following is about.
9) Each trader/ investor is different
I don't expect all of us have the same views, same way of trading and execution, and I don't care if you see me as different. There are many ways to make money from the market, just don't use it as an excuse to avoid self-improvement. See it more as an opportunity to learn and to share.
10) Anything can happen. Be flexible.
In two ways.
a) Despite technical overextension, the market can go much higher than you think. Remember there is always something which drives the primary trend - macro and fundamentals. And we never know if we have overpriced or underpriced all the unknowns and knowns.
b) It also doesn't exclude a reversal into a deeper correction (as in below 21ema) or into a bear market, although with some personal bullish bias I think the possibility is smaller.
So, be flexible.
These 10 advices is for me too, I need them too.
The following are the charts of $SPX and my three biggest positions for context.
$SPX
$NVDA
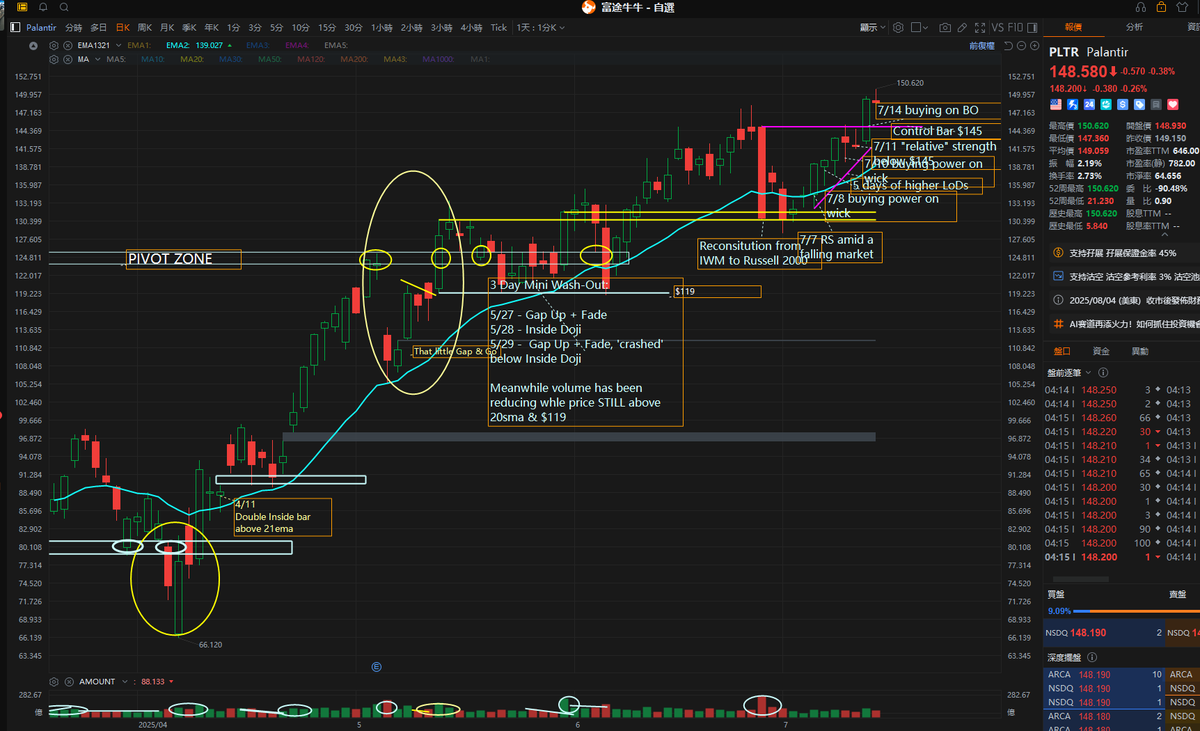
$PLTR
$HOOD
Executive Summary: 5/8 Early-Market Session
Hey team. Today we're reviewing yesterday's price action and discussing how to mentally frame "shakeout" days so you don't get shaken out of your best positions. We will also take a look at our market internals and establish our game plan for today.
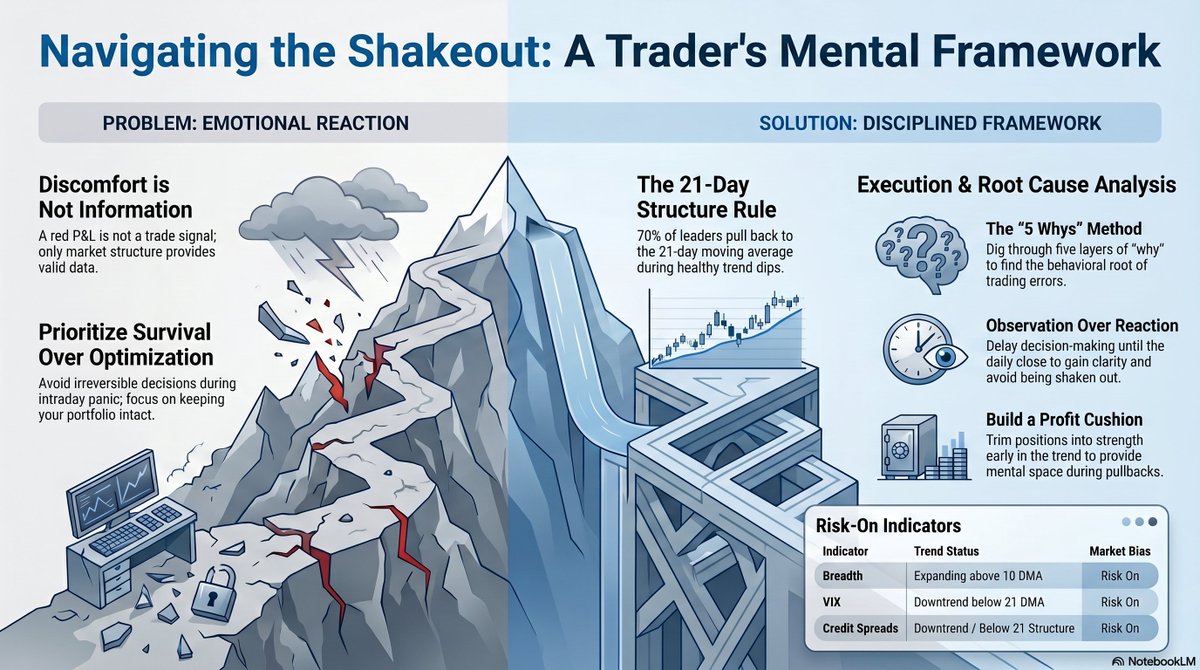
Mastering the Shakeout
If yesterday's drop had you stressed or acting out of character, give yourself some grace; learning to navigate these days takes time and practice. In a strong uptrend, the market typically takes the "stairs up, elevator down". It is entirely normal for market leaders to quickly drop one or two Average True Range (ATR) units within a healthy trend.
Your mindset on these days needs to shift from reaction to observation. Discomfort is not information, and a red P&L is not a trading signal. Instead, focus exclusively on the structures of the market and your stocks. When you get a nasty gap-down or an all-day slow bleed, avoid making irreversible decisions intraday. Forcing clarity in the middle of the session is usually how good positions get dumped out of fear; true resolution often doesn't happen until after the close.
If you struggled with execution recently—like buying at the top due to FOMO and then puking the position at the bottom—use the "Five Whys" exercise to dig deep and find the root cause of your mistake so you can learn from it.
Market Internals: Risk-On
Despite the recent shakeout, the underlying market trend and internals remain firmly "risk-on". The broader market is in an uptrend above a rising 21-day moving average (DMA) structure. Breadth is still expanding, and indicators like the VIX and credit spreads are in downtrends below their declining 21 DMA structures.
When the broader internals are risk-on and you see liquid leaders pulling back into their rising 21 DMA structures, you have to recognize that as a high-probability buying opportunity, not a trap.
Sector Leaders & Trimming vs. Trailing
Currently, leading groups include memory, power semiconductors, analog semiconductors, and power equipment. When managing positions in these fast-moving sectors, the goal is to trim into strength when a stock becomes overextended.
By trimming portions of your position (like 1/3 or 1/5) into extensions, you build a profit "cushion". This cushion allows you to confidently hold the rest of your core position through inevitable shakeouts. You can then rotate that locked-in capital into fresh setups—such as other leaders successfully backtesting their 21 DMA—to catch early momentum, rather than chasing stocks that are already extended.
Today's Game Plan: "Panda Mode"
Today, we are going into "panda mode"—meaning absolute patience and neutrality. Keep an open mind and don't declare victory just because you bought yesterday's dip. You must let the market confirm its direction.
If the market confirms the uptrend and our new positions work, we will trim to de-risk and build out our core holdings. If the market fails and leaders break down below their structures, we will cut our new risk immediately and get off margin. Have your scenarios mapped out in advance so you know exactly how to react without emotion.
Have a great Friday, a restful weekend, and a happy Mother's Day to the moms in the group.