Proud to announce that @CodSpeed has joined the Rust Foundation as a Silver member!
We’re all-in on making Rust (and everything around it) fast and staying that way. Supporting the Project that makes that possible felt like the obvious next step.
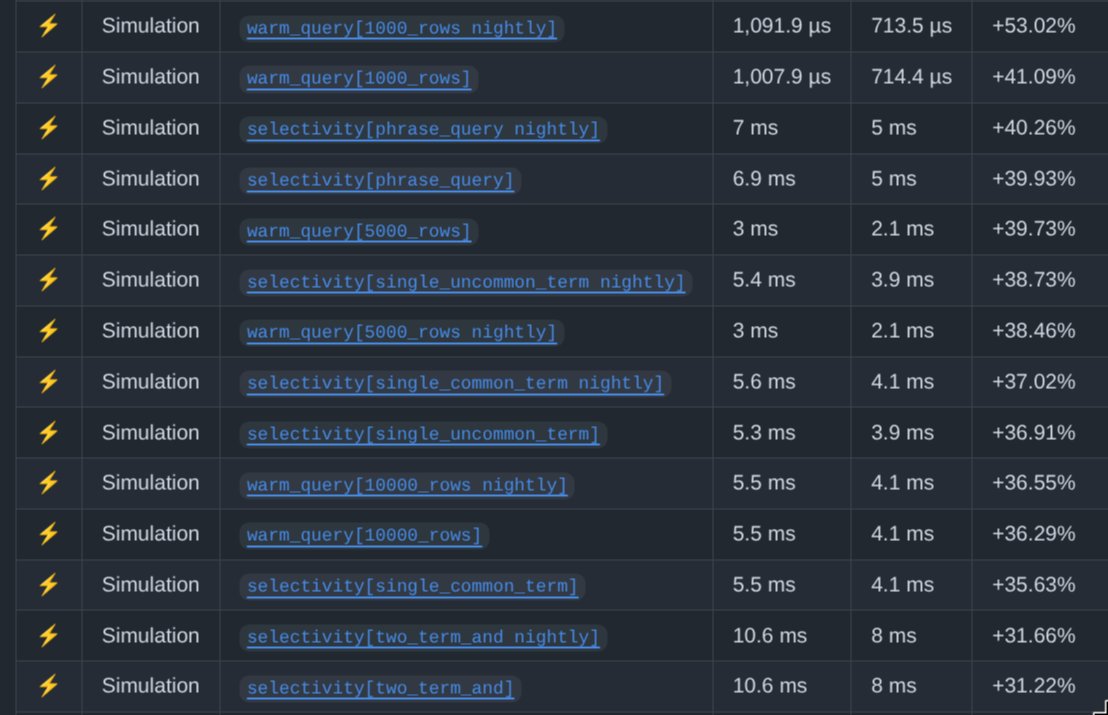
Significant `jiter` release, in particular this includes SIMD support for x86, which should give up to 7x performance improvement for parsing long strings.
There are also significant improvements for tape reuse, arm64 string SIMD, float parsing and more.
jiter is the most used 3rd party JSON library in Python as a dependency of @pydantic validation.
it's also used in Pydantic Monty, and in Pydantic Logfire via datafusion-functions-json.
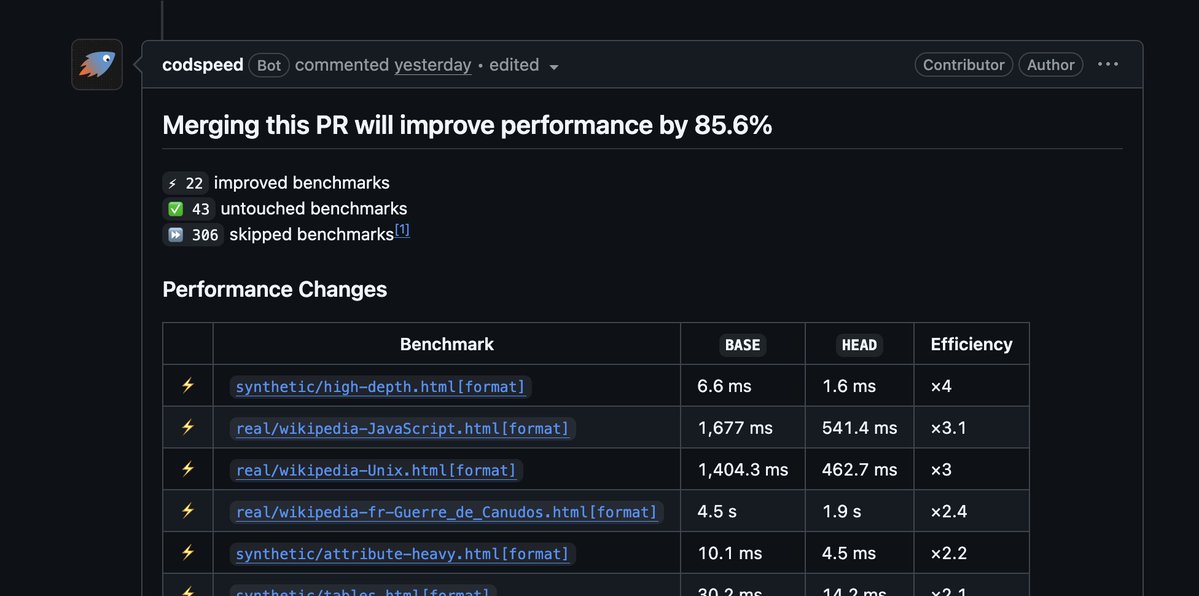
Short story: apply strict constraints, provide clear benchmarks for the thing you want to improve, use @codspeed, let fable and astra do their thing.
https://t.co/ftAAfrhWhj
CodSpeed v5 is out, with two big changes to how we measure your code.
First, cycle estimation. Until now, every instruction was charged the same cost, but a `div` is ~25x more expensive than a `mov` on real hardware. We patched Callgrind to emit per-instruction metadata and built a cost model on top, weighting every instruction by its measured cost on real CPUs, cache misses included. Replacing a division with a multiply now shows up in your benchmarks the way it shows up in production. Just upgrade and you'll have it on by default.
Second, allocation exclusion. Allocators are non-deterministic by design: their cost depends on the OS, the implementation, the version. If you're optimizing your own code, that's pure noise. v5 tags every allocator frame in the call graph and subtracts its time from the reported value. The flamegraph still shows the frames, only the number changes. Opt in with the `exclude-allocations` flag.
Just upgrade your action to CodSpeedHQ/action@v5 and you're set.
Only your code, at its real cost 🚀
🥇 @codspeed: the performance platform that catches regressions before they hit production, autonomously suggesting and validating optimizations across CPU modeling, profiling, heap analysis, and more. Free for open source.
Thank you for supporting #rustconf at the Gold Level, CodSpeed! https://t.co/ca2UslAfrA
“op read” (@1Password cli) takes almost 1s to read a secret. Apple’s “security” is sub 100ms. Is there some trick to make 1Password faster (on an M4 Max machine?!) so I can actually use it in scripts?
To be honest Apple’s 90ms for a secret retrieval is questionable too.
A flame graph that merges all threads is lying to you. That "hot" function might be a GC thread, not the request path.
You can now filter flame graphs down to specific processes and threads, or split them to see exactly how the work is distributed in @codspeed
Also available in the CodSpeed MCP: your coding agent profiles the exact worker it's optimizing.
Your benchmark moved. You didn't touch the code.
A compiler bump, a new system lib, a different CPU flag. Any of it shifts the numbers.
CodSpeed now diffs the environment between two runs, so you know when it's the toolchain that changed and not your code.
https://t.co/P3BzQtMNCo
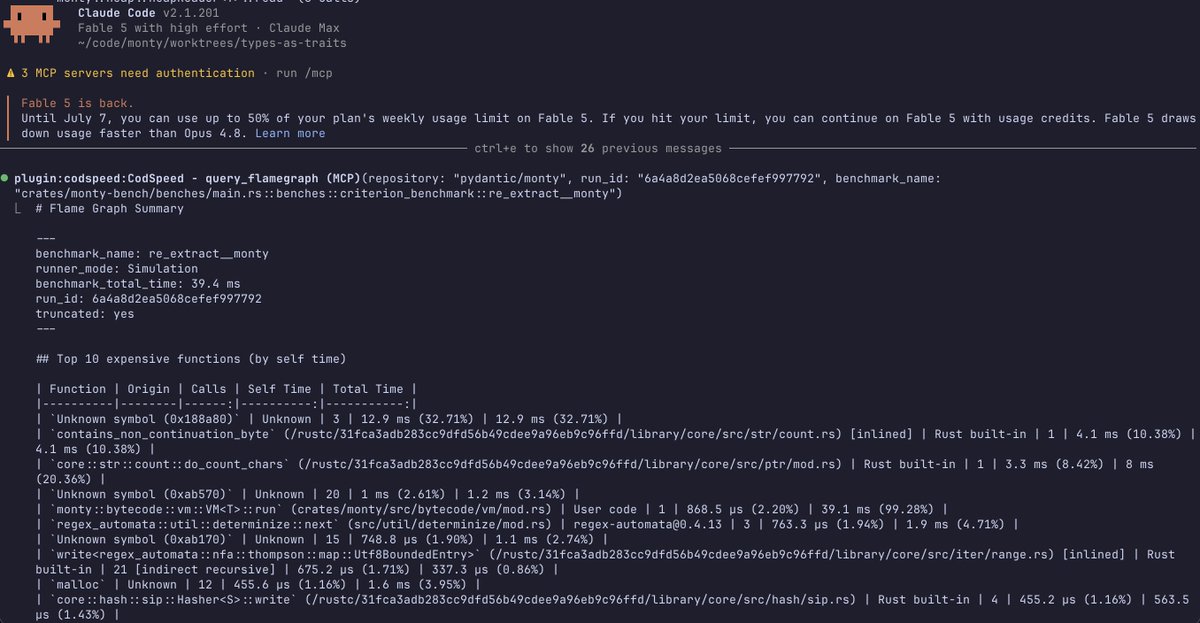
This is exactly what we had in mind building our MCP server. Your agent gets the same level of details you can get by browsing profiling data and finally have insights on what and how to optimize
Performance work with @codspeed's MCP server feels like a cheat.
Instead of stumbling round in the dark with a machete, attempting to hack at random patches of code, Fable and I are a sniper - the MCP tells me which code is slow, we figure out how to make it fast. Rinse. Repeat.