$ADA (1D) NFA.
We’re sitting in a clear dealing range (blue box). Current price around 0.356 = mid-range / slight discount. This is where the market prints chop + traps and farms leverage.
Liquidity map
Sell-side liquidity (SSL) is around 0.333–0.335 (stops under the lows). The marked wicks show an SSL raid already happened - a classic stop run / liquidity grab before any real expansion.
SMC logic
Smart money often cleans SSL first, then looks to reprice upward into the next obvious pool: buy-side liquidity (BSL) near 0.382–0.385 (stops above the range highs). Inside the box is basically “make both sides wrong” territory.
PD arrays / key zones
Main demand / bullish OB: 0.334–0.345
Likely imbalance / FVG pocket: 0.346–0.352
“Discount / OTE-ish” area: 0.352–0.367
This is where longs can make sense only if structure confirms.
Confirmation (to avoid getting chopped)
Need a bullish MSS/CHOCH with real displacement, ideally a reclaim / daily close above 0.366–0.370. Without that, it’s still range noise and you’re just providing exit liquidity.
Targets if the shift prints
First magnet: EQ (mid-range) ~0.378
Then: range high / BSL 0.382–0.385
If we break & hold above, next magnets: 0.40 → 0.42/0.425 (EQH) → 0.44+
Invalidation
Daily close below 0.332–0.333 = bullish idea is cooked → higher chance of continuation to lower lows.
TL;DR: SSL got swept. Now wait for MSS → then BSL becomes the draw. NFA.
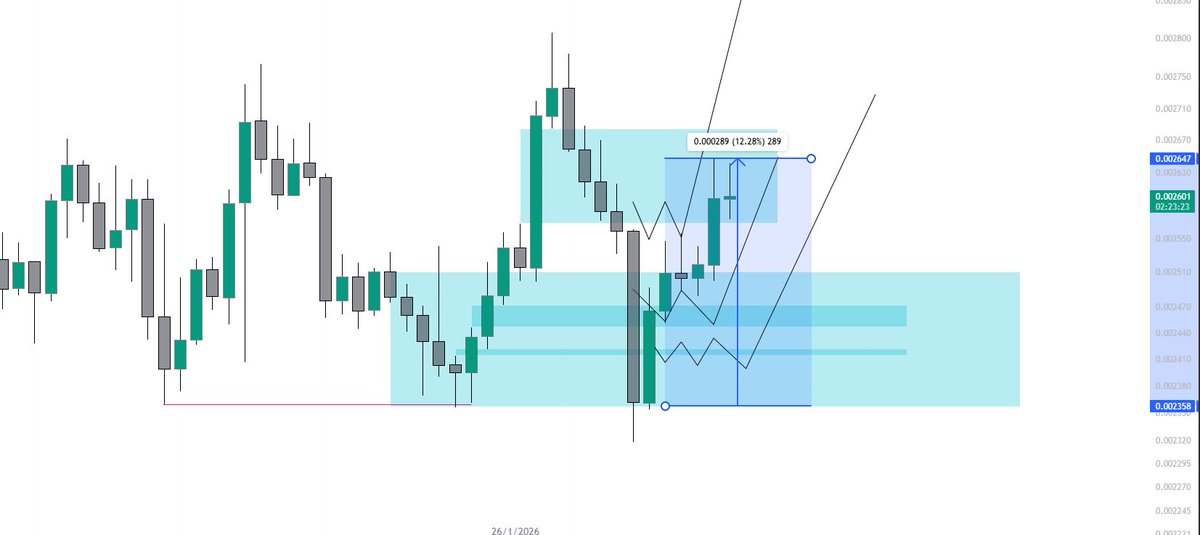
$PUMP (4H) ICT
Price printed a bullish impulse and has now retraced into a key demand zone (blue boxes), perfect for mitigation. Looking for a sweep of the internal lows (liquidity grab) before a sharp reversal.
Key setup:
Sweep of the lows (liquidity hunt)
Bullish displacement → confirmation of trend shift
Targeting next BSL (Buy Side Liquidity) above the range.
If we hold in the blue boxes, expect a move to the upside. Below = invalidation.
Not financial advice, just structure & liquidity mapping.
#Crypto #Trading #ICT #PUMP
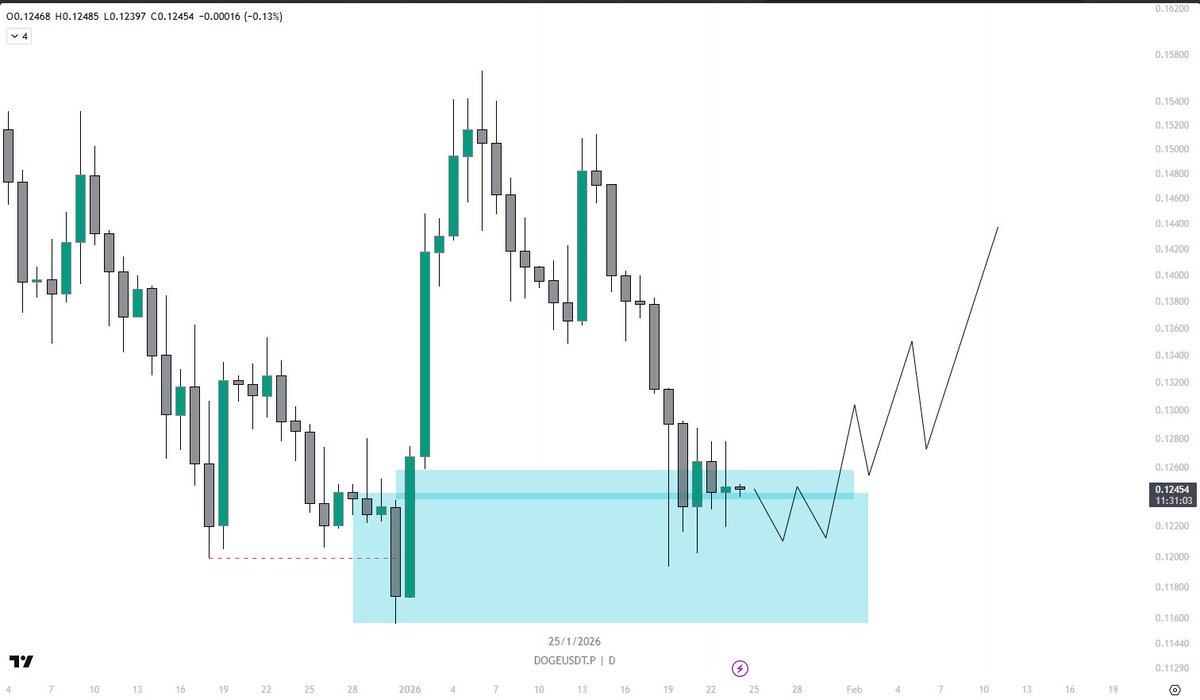
$DOGE (1D) — ICT / Smart Money idea
Price has retraced into a major discount / demand POI (blue box) after the sell-off and is now basing. This area looks like a clean mitigation zone (bullish OB / imbalance fill) where smart money can reload. Expect some chop and possibly a small sweep of the internal lows (SSL) inside the box before a stronger expansion higher toward the next liquidity above (swing highs / BSL).
Invalidation: daily acceptance below the blue zone low.
NFA - structure + liquidity map only.
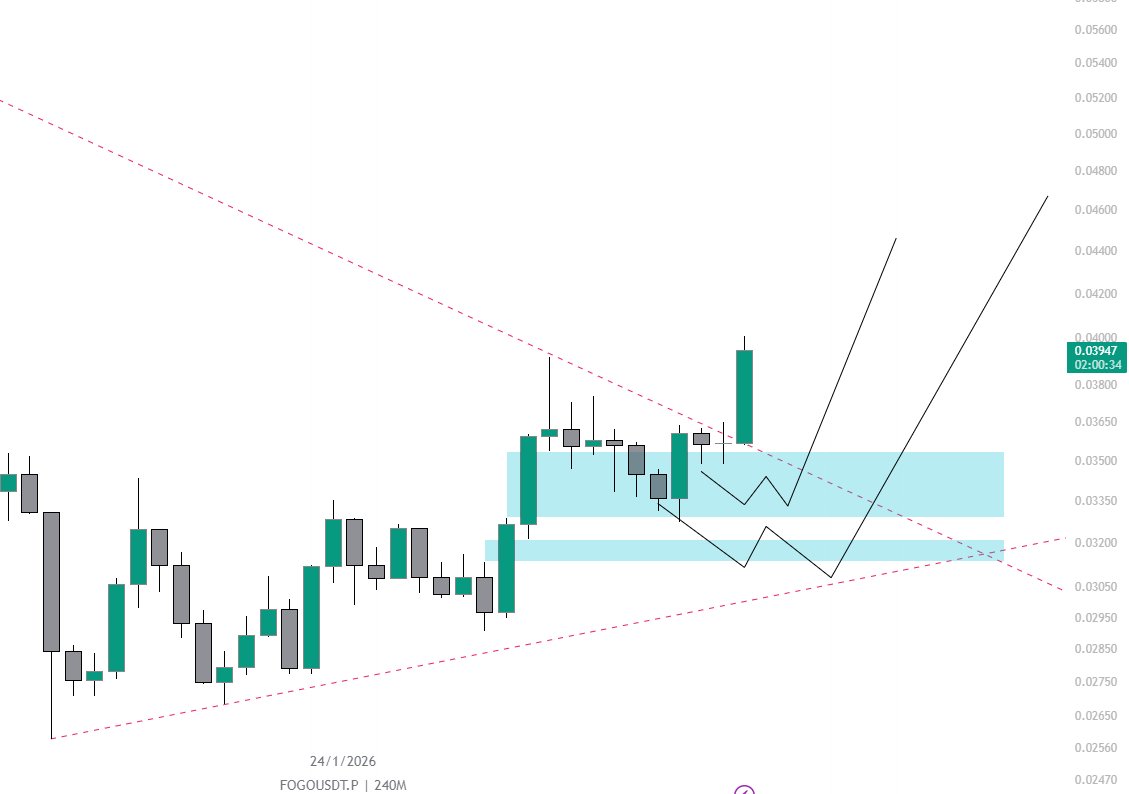
NFA. $FOGO (4H)
Big picture is still bearish (clean downtrend on the left), but the right side shows an important change: strong bullish displacement into a key zone.
What stands out:
Bearish orderflow first: LL/LH structure dominated for a while.
Compression at the lows: Price bases and starts printing higher lows (often a sign of absorption).
Displacement up: The large green expansion candle is a “statement” move—often the first clue of internal MSS (shift in delivery).
Current price = consolidation in POI (blue):
Upper blue box looks like a premium area / supply reaction zone where price is pausing.
Lower blue strip is a cleaner demand / mitigation zone (often aligns with a bullish OB or the origin of the impulse).
Liquidity logic:
Short-term BSL sits above the tiny swing highs in the consolidation. A clean breakout can run that liquidity.
Most common path (ICT):
small sweep of an internal low (inducement)
LTF displacement + BOS
expansion toward higher liquidity pools
Invalidation idea: acceptance below the lower blue zone low = bullish mitigation thesis weakens.
Not financial advice - just structure + liquidity mapping.
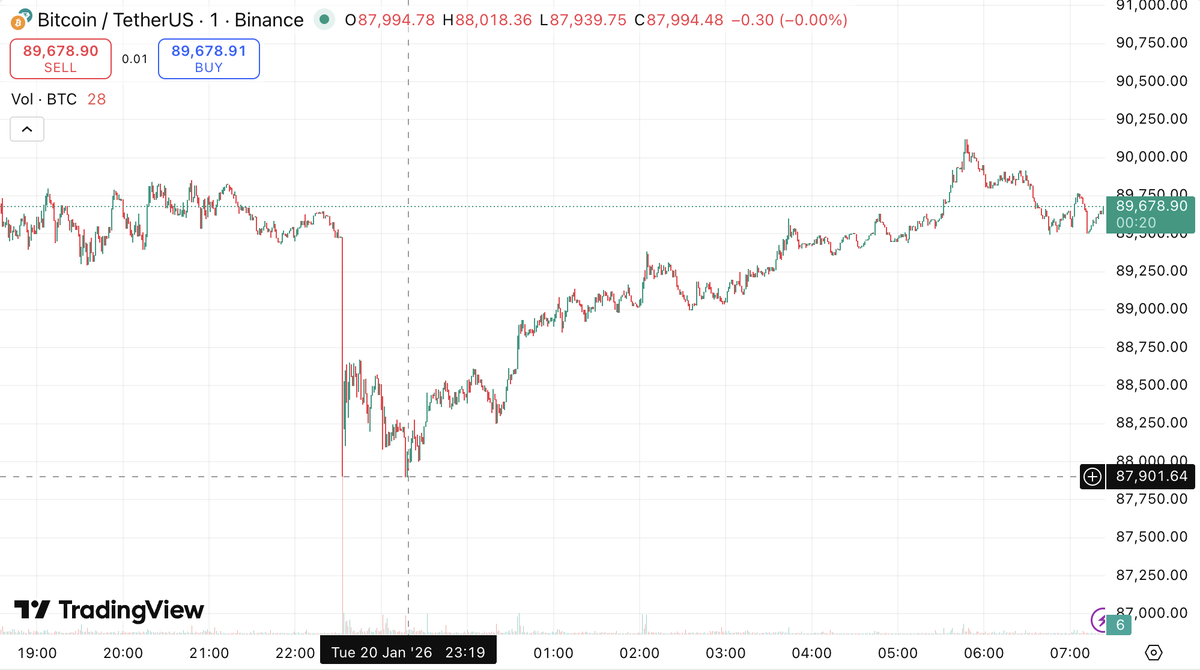
Bitcoin Dips Below $88K, Triggering Over $1B in Liquidations
Bitcoin experienced a sharp pullback, briefly dropping below $88,000 on January 20-21, resulting in over $1B in liquidations across the crypto market within 24 hours.
According to Сoinglass, @HyperliquidX led the exchanges with $297M in liquidations, followed by @Bybit_Official with $212M and @binance with $175M. Bitcoin accounted for $380M in liquidations, with Ethereum at $352M and Solana at $39.6M being the top affected assets
The sudden drop coincided with geopolitical tensions as President Trump made controversial statements about Greenland and potential territorial expansion, creating uncertainty in risk markets.
Data source 🔗 @coinglass_com
#Bitcoin #Сoinglass
nfa
SOL was in a steady downtrend for a while, but now we’re in a bit of a range for the past couple of months, indicating that buyers are starting to step up. We’re currently in the Fair Value Gap zone, and that could be the spark for breaking the next levels around ~$135, ~$140, ~$146. Those are the barriers Solana needs to smash for the next bullish move.