KAIA, four days in October.
Oct 9 — the price closes +61% on the day.
Hours later the funding rate hits its floor: −2.0000%. Binance shortens settlement from four-hourly to hourly.
It stays there. Of the next 111 funding payments, 108 are negative. For four days, shorts pay longs every single hour.
Here is what the price did while longs were being paid:
Oct 10 — −5.8%
Oct 11 — −8.0%
Oct 12 — −12.8%
Oct 13 — +4.0%
Six separate events were recorded on this one coin in four days: four extreme-funding readings, one volume surge, one volatility regime.
The 72-hour range reached 88.4%. Normal for this coin over the same span: 13.5%. Six and a half times its own.
Traded value hit 22× its own median — 5.63M against 256.3K. Binance 22.0×, KuCoin 21.1×.
And every one of those six events closed its next 24 hours negative: −4.0%, −5.4%, −8.0%, −6.4%, −7.1%, −7.8%.
Being on the paid side of the funding rate and losing anyway is not a contradiction. It is just what the tape did.
Every figure above is a recorded measurement with a timestamp, not a forecast.
kaia:native
We built a crypto event log that grades itself — including when it’s wrong.
Take MAGICUSDT. Ten events recorded. Eight have had their following 24 hours measured. Six of those eight closed lower.
That is on the coin’s own page, by default, not buried in a methodology PDF.
Every record completes automatically once the next 24 hours exist, and it shows all three numbers — the high, the low, and the close — whichever way they went. One MAGIC record reads: high +19.3%, low −7.1%, close +2.4%. Same event, both tails. That row is the whole thesis.
Site-wide: 1,001 events recorded, 951 with the following 24 hours measured. No ranking, no highlighting, no “top signals” tab. An event is a departure from the coin’s own normal — not a forecast, and the log is built so you can check that claim against its own record rather than take my word for it.
We also measured why it is built this way. On 822 pairs and 3.29M hourly candles of thin-book data, an hour with ≥5× its own normal volume roughly doubled both tails over the next 24 hours: P(≤−10%) went 2.1% → 4.4%, P(≥+10%) went 3.1% → 5.0%. Both, together. Which side was aggressive made no difference at all.
So the honest output is not an arrow. It is a wider distribution, shown in both directions, with the record kept whether it flattered the method or not.
https://t.co/ZdaX7hvVaL
Observational, past tense, historical data. Not investment advice.
base:0xf1572d1da5c3cce14ee5a1c9327d17e9ff0e3f43
1/ “Volume exploded but net capital inflow turned negative.”
We measured it. 822 pairs, 3,290,659 hourly candles, thin books only, six months.
The flow sign predicted nothing — but two things that looked like signal died in instructive ways. 🧵
2/ First the term. There is no net capital flow in a trade. Every fill has a buyer and a seller, same size, same instant.
What “net inflow” actually measures is who crossed the spread:
flow = 2 × taker_buy_quote / quote_volume − 1
A share of turnover. Not money entering anything.
3/ Thin pairs, after an hour with ≥5× its own normal volume. Next 24h:
flow negative → −0.36% median, 55% down (n=14,775)
flow positive → −0.45% median, 56% down (n=11,904)
Twins. The two extremes of flow were twins too.
4/ What the loud hour DID predict: both tails, together.
P(move over next 24h):
≤−10% ≥+10%
baseline 2.1% 3.1%
loud hour 4.4% 5.0%
Not “it falls.” It moves more, either way.
5/ Then the first trap. Flow quintiles made an inverted U — balanced middle worst (−0.77%, fattest tails), both extremes mild.
It was the trade count: 2,266 trades in the extreme-flow quintile vs 7,394 in the balanced one. Hold it fixed and the shape collapses.
6/ Second trap, the harder one. A residual gap survived: +0.57 to +0.67 points, day-clustered interval excluding zero, and the opposite sign to the hypothesis.
It was the bar’s own return. rho(flow, bar return) = +0.522.
Hold the return fixed → +0.34 / −0.10 / −0.30. Sign flips, zero inside every interval.
7/ If you measure order flow, put both controls in before you look: the trade count, and the bar’s own return. Without them a flow study confirms itself.
Eighth directional hypothesis like this measured and buried. The survivor says how far, never which way.
Observational, historical, past tense. Not advice.
@NullMaskio There's some confusion here. On MEXC, when you click "Info" on the MASKSOL/USDT pair, it redirects to your address, but you keep referring to it as MASK, and there's also a separate MASK/USDT trading pair. Could this be causing confusion?
$1 into each of the 99 highest-volume pairs.
Out again 60 seconds later.
Repeated for 499 consecutive minutes.
Prices barely moved: the basket finished higher in 49.9% of those minutes (mean +0.0007%).
The cost of doing this (spread + taker fees, both ways) was 0.419%.
Result: 0 out of 499 minutes finished positive.
Not a single one.
#crypto #trading
@tikoxbt There are plenty of projects that look like PVE setups, but unfortunately, a lot of them get rugged just days after getting listed on exchanges...
Most feeds show you the spike. The hard part is showing what came after it.
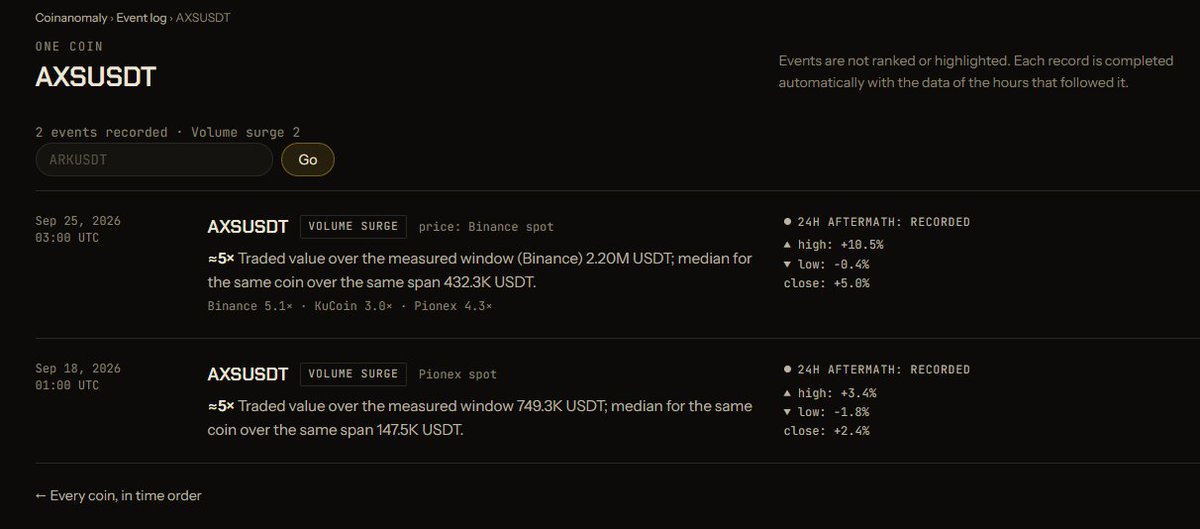
ethereum:0xbb0e17ef65f82ab018d8edd776e8dd940327b28b traded about 6× its own normal volume in one hour on Oct 2. That row currently reads "24h aftermath: not recorded yet" — it fills in by itself, high, low and close, whatever they turn out to be.
Two from September are already filled in.
https://t.co/katcH4QxlL
Before entering any trade, it helps to check if the coin has just broken from its own usual patterns.
CoinAnomaly records those moments — volume surges, unusual funding rates, volatility shifts — measured against each coin’s own history. No calls, no predictions.
Just the data and what followed similar events in the past.
A quick look before you size a position can add useful context. #Crypto #Trading #MarketData #CoinAnomaly
https://t.co/klXc1HzlIY
While building internal screens for crypto grid systems we measured something that changed how we look at volume:
At matched volume, money arriving through many separate trades was followed by 2–4× more grid fills than the same money arriving through a few large ones.
Volume fills the volume column. It doesn’t move the ladder.
The checks we currently run are mostly mechanical:
• mint revoked, contract not upgradeable
• withdrawals open
• tick and spread small relative to grid step
• listing old enough to have a baseline
• drift vs range behaviour
What would you add to this list?
#Crypto #GridTrading
After records like this one
Taken over 307 completed records of this type
Typical 24h range 12.9%,
Typical high high+4.9%,
Typical low−5.1%
These are the sizes of the moves that followed, not their side. This project measured the width of a coin’s range to be the part that carries; the direction was a coin toss, so no share of rises and falls is published.
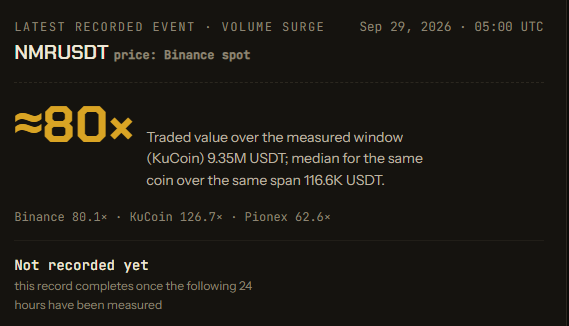
🚨 ethereum:0x1776e1f26f98b1a5df9cd347953a26dd3cb46671 just recorded a massive volume anomaly.
~80x its usual traded value over the measured window.
Binance: 80.1x
KuCoin: 126.7x
Pionex: 62.6x
An interesting one to keep on the radar. 👀
Not financial advice.
https://t.co/klXc1HzlIY
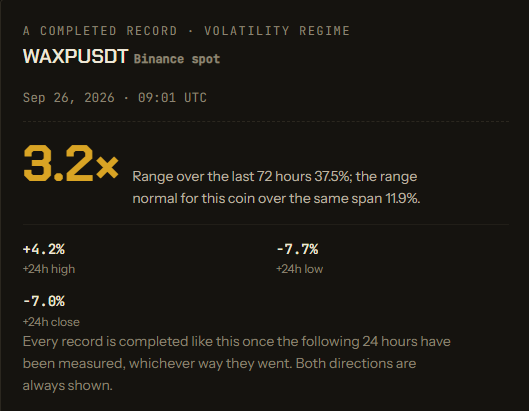
🚨 ethereum:0x2a79324c19ef2b89ea98b23bc669b7e7c9f8a517 just entered a volatility regime.
3.2× its normal 72h range.
Anomaly detected. Data recorded.
🔎 Full record ↓
https://t.co/mt1a9oLUzq
CoinAnomaly — Spot the unusual.
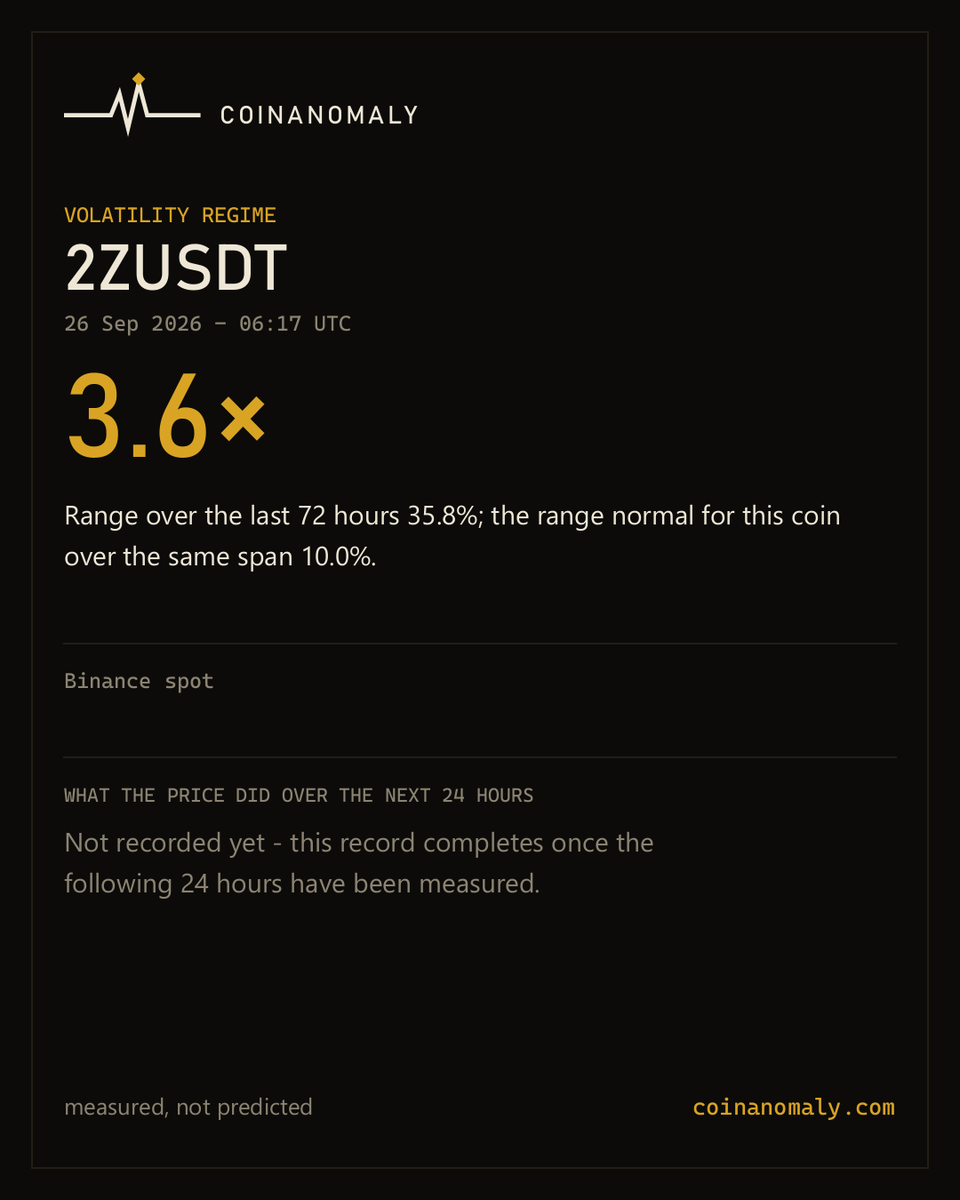
$2Z's own 3-day range ran 3.6x the range that is normal for it. 35.8% against 10.0%.
Binance spot, 26 Sep 06:17 UTC.
We measure width, not direction — and we publish what the next 24 hours do, whichever way they go.
https://t.co/i0PzgQ9naa