"Next #Crypto Unicorns? Your 100x Cheat Sheet for 2024! 🦄💰"
1️⃣ $EVO - Tiny cap, huge potential, all on Avax. EvoVerses is serving up NFTs with a side of sass.
2️⃣ $CHAX - First BRC-20 RWA, mixing liquidity and yield like a pro.
3️⃣ $BETS - BetSwirl's spicing up GambleFi on three chains.
4️⃣ $THE - ThenaFi's the dark horse DEX on BSC.
5️⃣ $BIFI - Yield optimizer beefing up the bull run.
6️⃣ $ATOR - Chat on the DL with crypto incentives.
7️⃣ $GFAL - Gaming with a side of earning? Count us in.
8️⃣ $PENDLE - Yield token trading with an RWA twist.
9️⃣ $RDNT - Biggest lender on Arbitrum, about to take off.
🔟 $0X0 - Privacy with AI smarts? Yes, please!
1️⃣1️⃣ $POLYX - Making security tokens sexy again.
1️⃣2️⃣ $RBN - Structured products with Paradigm's brainpower.
1️⃣3️⃣ $KUJI - DeFi with a Cosmos vibe.
1️⃣4️⃣ $RNDR - GPU rendering's poster child.
1️⃣5️⃣ $RUNE - Cross-chain wizardry at its finest.
1️⃣6️⃣ $TAO - AI's darling with a 6X glow-up.
1️⃣7️⃣ $INJ - Cheap, fast, and heavily backed.
Slide into the comments with your picks or crypto wisdom! 🧙♂️💬 #CryptoMagic #BullRunReady
Classic 4-year cycle ATH?
Anticipation?
A lot of people are confused about this topic.
Time to spend a few words explaining in a deeper manner the outcome of this cycle. (read it till the end cause it’s important)
🔸 4-year pattern
Since its inception, Bitcoin has produced a classic 4-year pattern.
This is clearly evident if we measure the length that passes from top to top and from bottom to bottom:
• 2013 top ~> 2017 top = 1477 days
• 2015 bottom ~> 2018 bottom = 1428 days
• 2017 top ~> 2021 top = 1435 days
• 2018 bottom ~> 2022 bottom 1428 days
The average interval of time that passes from each significant point is indeed and approximately 1400 days.
Making a similar projection of the cycle would put the next Bitcoin top in Q4 2025 and the next Bitcoin bottom in Q4 2026.
But the tide is turning and this projection seems not to make sense anymore..
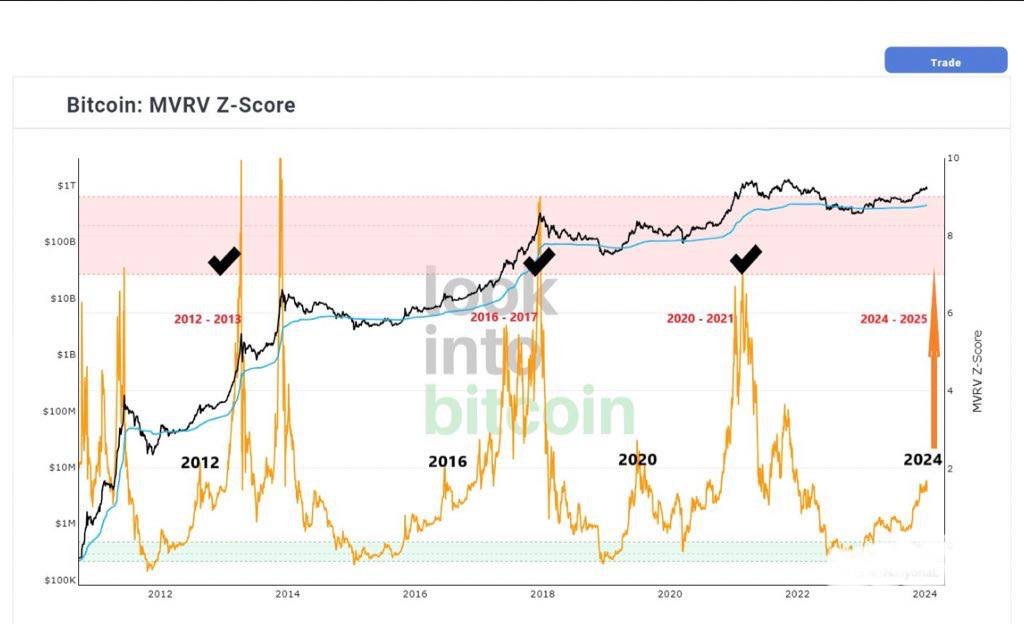
🔸Halving, the bullish catalyst
Historically speaking, the halving (✂️ in the chart) has been the most bullish catalyst for seeing Bitcoin transitioning into the parabolic phase of the run. (global liquidity also)
Over time, this pattern has been very well-known and the technical impact (reduction of miners' reward) has lost its previous magnitude, given the availability of Bitcoin's current supply, estimated to be more than 90%.
The proof is in this cycle.
Bitcoin has always been rejected from the 0.618 Fibonacci level, producing a harsh correction before running post-halving date.
This cycle instead, Bitcoin has broken above the 0.618, something extraordinary and unique.
This brings us to the next important point..
🔸 Left translated cycle
“Left translated what?”
A left-translated cycle would entail an aggressive run-up earlier than usual in the 4-year cycle and prior to the midpoint (60 days cycle rule) contrary to the right-translated cycle where the peak occurs after the midpoint.
The current midpoint is estimated around October/November 2024.
This means, dear Padawan, that if we break the ATH before the midpoint, the cycle will be much shorter.
“Isn’t it possible to see it running till Q4 2025?”
Unlikely, in my opinion.
Despite global liquidity rising flashing a positive outcome for risk-on assets (that should be extended till 2026) I don't see Bitcoin continuing to go up from the ATH period to late 2025.
Most institutional investors are and would be at huge profit (millions and millions) and, as previously said in past analysis, they will not need the moon to capitalize.
Hard to think we will experience 2 years of parabolic bull market, isn't it?
🔸To conclude
“The more firmly a pattern is established in the markets, the more it will be front-run in the future by traders who believe they know what is about to happen.”
This seems to be the case of this quote.
I already explained my theory regarding the Bitcoin top, which is sustained by the U.S. presidential elections and which, at this stage of the cycle, moves the attention to this Q4/Q1 2025.
The signs of a left-translated cycle are getting stronger and we should adapt to
market dynamics.
As always, what matters are HTFs, and they’re clearly bullish.
Both for Bitcoin and altcoins.
The main strategy remains one and only one:
• Buy spot
• Ride the trend
• Be prepared for dips
• Don’t use leverage if you don't know how to
• Pay patience
Overcomplication not needed.
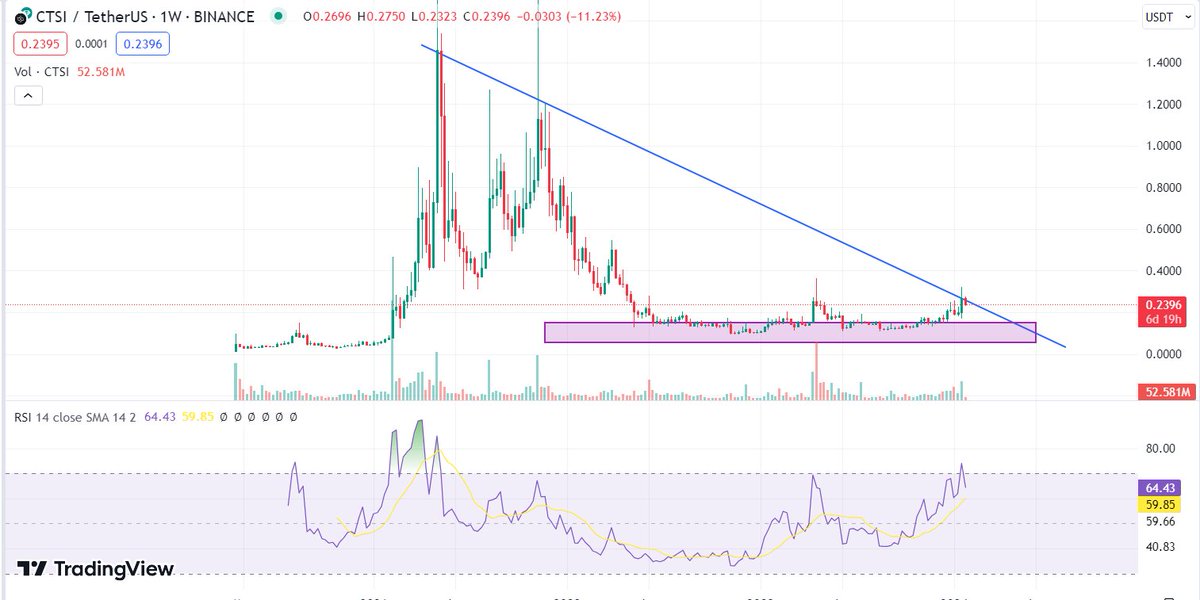
$CTSI is experiencing a surge with high trading volume, attempting to break out from its ascending triangle pattern. A successful breakout and retest could signal a bullish trend, while a rejection might indicate ongoing trading within the triangle. #CTSI#CTSIUSDT
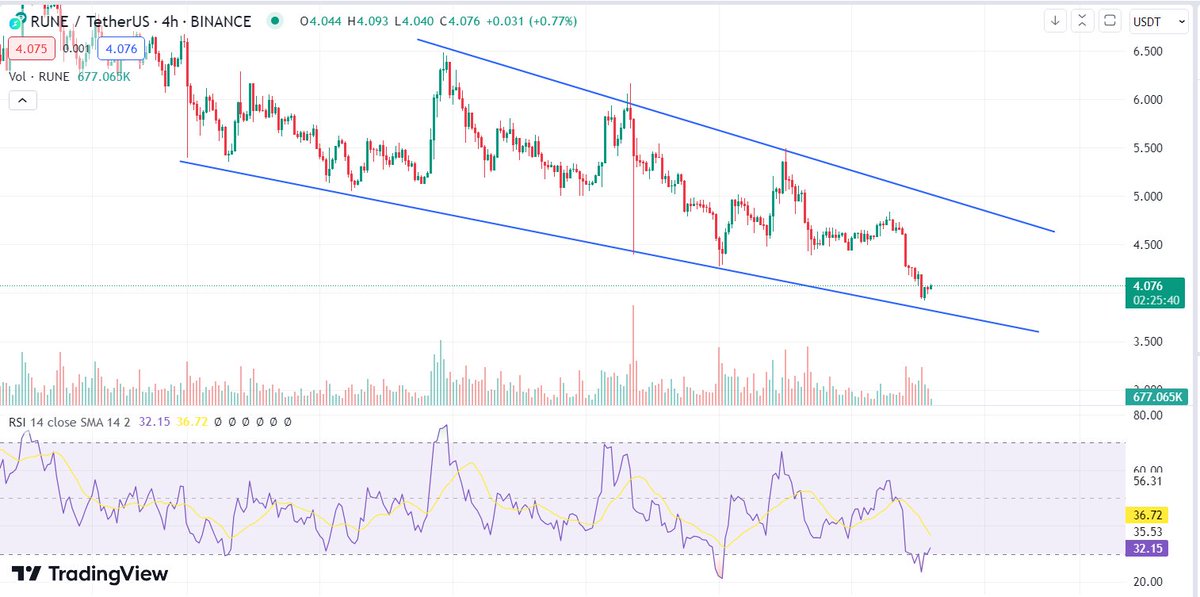
$RUNE is in a downtrend, avoid long positions. Wait for support test. Expected to fluctuate between $3.25-$3.60 (support) and $5.15-$5.40 (resistance).
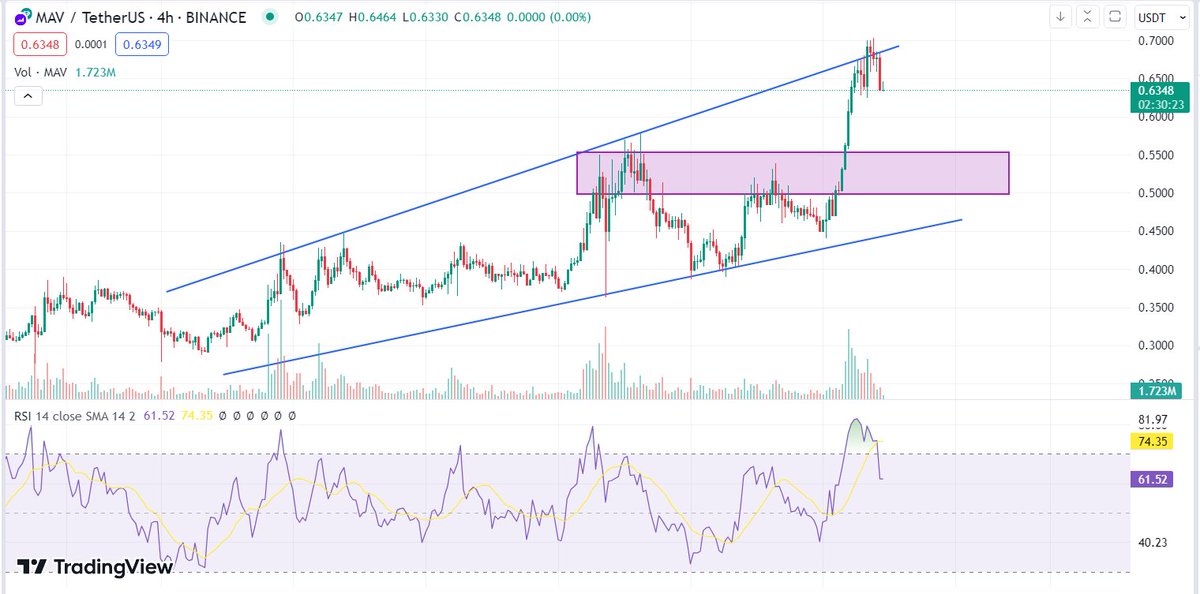
$MAV is at a record high. Consider a small long position with a stop loss, but be cautious as it's risky. Next resistance near $1. Use risk management. #MAV#MAVUSDT
$AUCTION top gainer: Breakthrough past key S/R level with high volume. Look for a retest of this level as a promising entry point. #AUCTION#AUCTIONUSDT
$BOND analysis: Frequent tests of resistance hint at a potential breakout. Watch for a close above the $3.50-$3.68 resistance area, backed by a supporting uptrend line, for a solid buy opportunity.
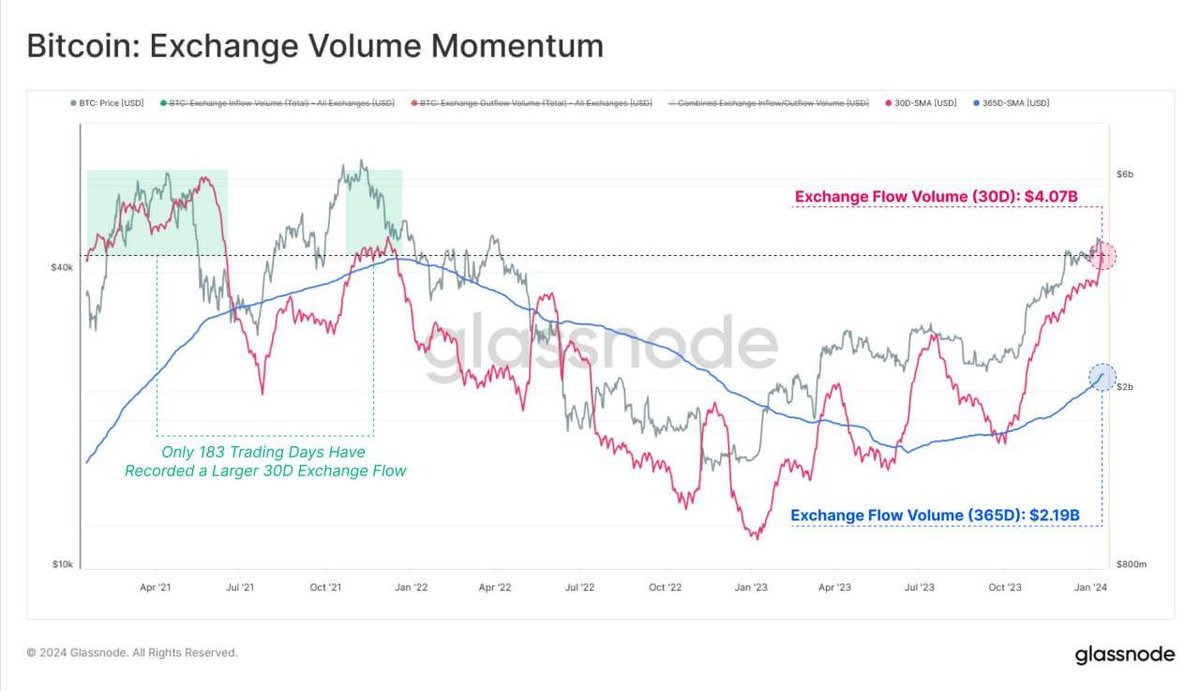
#Bitcoin likely to see heightened fundamental volatility, with exchange inflows and outflows at levels mirroring the last bull market peak. Keep an eye out! 👀
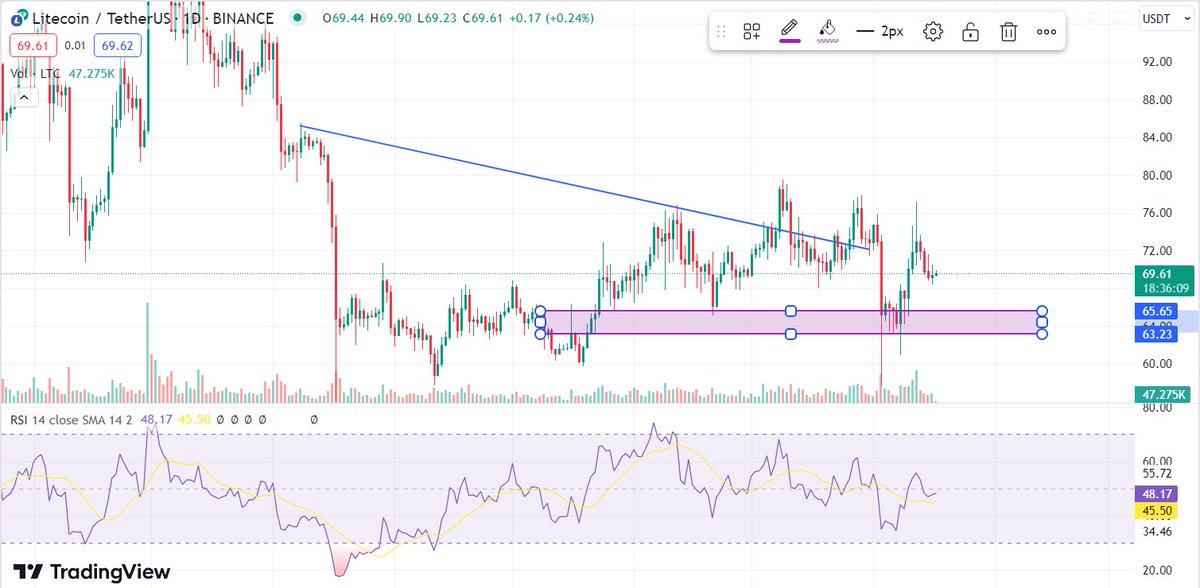
$LTC daily analysis: Expecting a reversal upwards soon. Noticing a dump rally and a double bottom pattern. Predict a move towards the local order-block near $67.5 before an upward shift. #LTC#LTCUSDT
$CHR on 1W chart shows strong bullish signals, breaking above a pennant, rounding bottom, and horizontal rectangle. Anticipated major upward movement makes it a promising spot investment. #CHR#CHRUSDT
$DODO is at a resistance zone. A break above could lead to significant gains, while rejection might drop it to support levels between $0.128-$0.14. Resistance is at $0.187-$0.202. #DODO#DODOUSDT
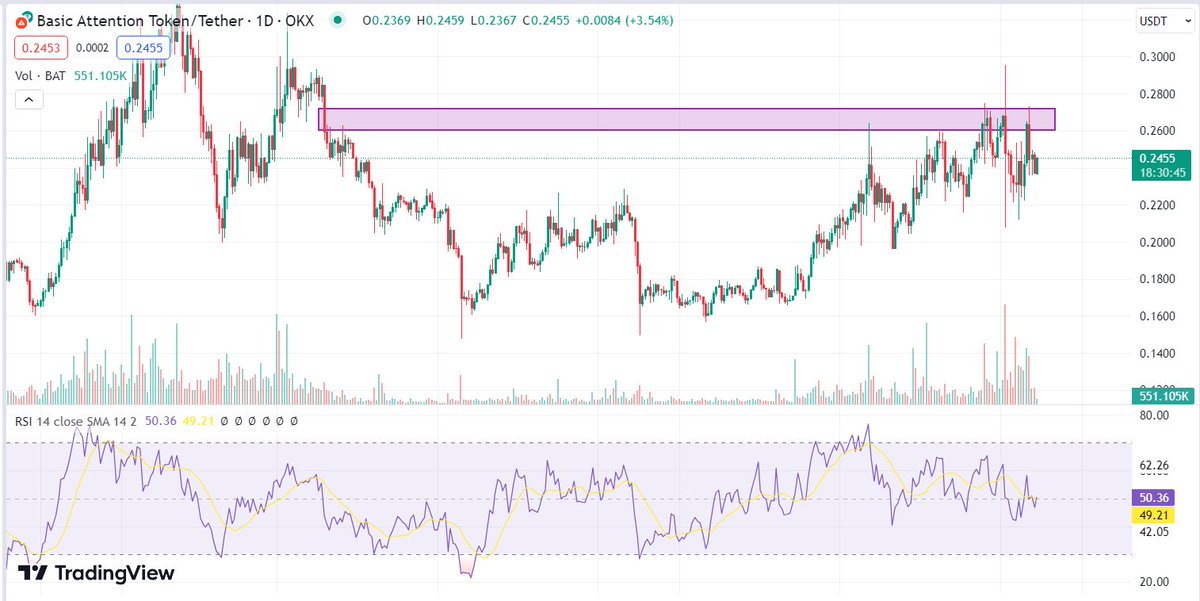
$BAT faced repeated rejections at resistance. Potential test of support area soon, ideal for new entries. Support: $0.226-$0.232. Resistance: $0.257-$0.267. #BAT#BTAUSDT
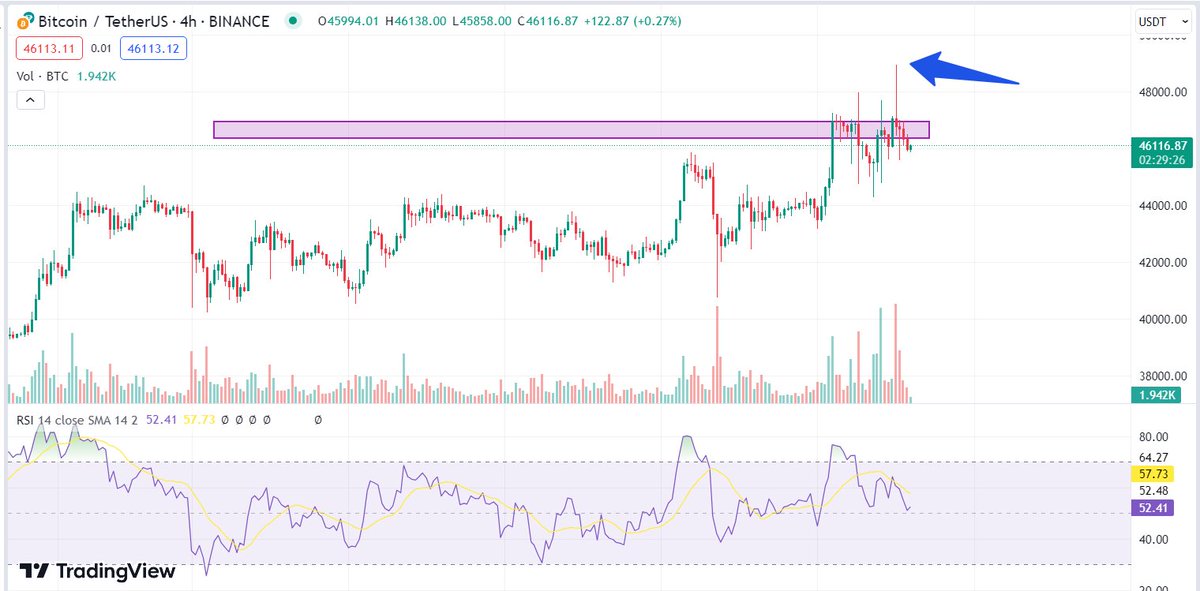
#Bitcoin faces resistance at $48,000, dropping but holding above $45,000 support. Meanwhile, Altcoins show strong gains. Stability above $45,000 could sustain the trend. $BTC #BTCUSDT
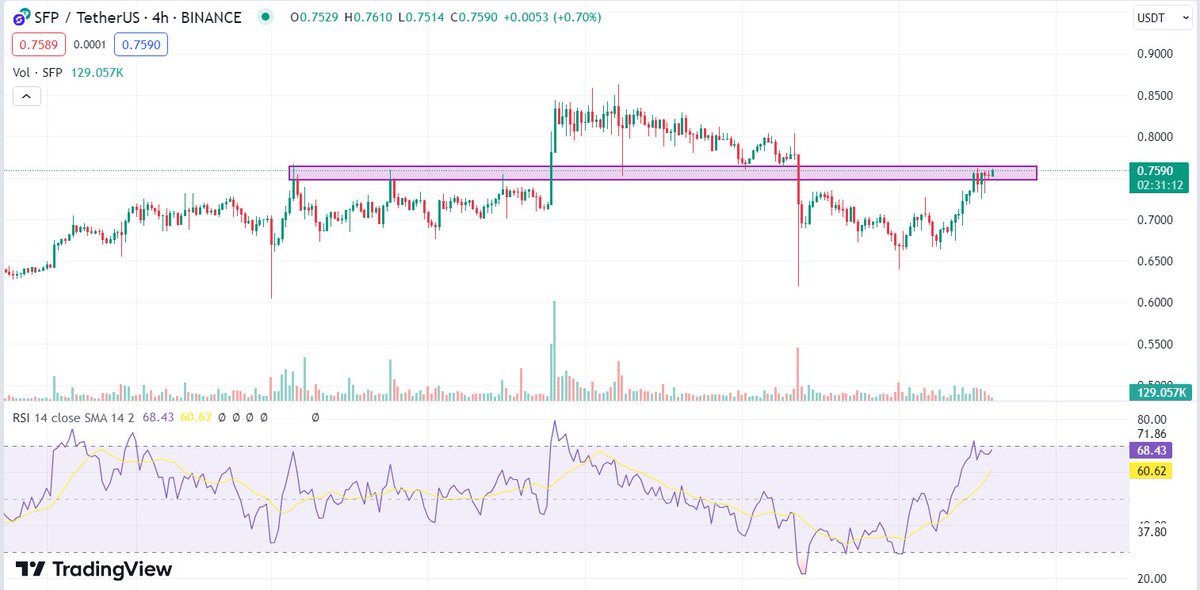
$SFP Price nears resistance at $0.73-$0.75. A confirmed breakout above signals a bullish trend, possibly reaching next resistance at $0.83-$0.86. Await breakout confirmation before entering. $SFP #SFPUSDT
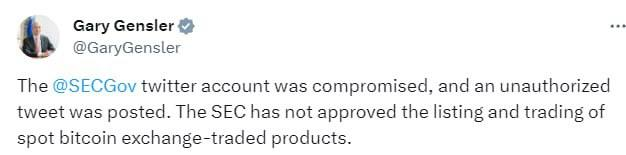
Clickbait Alert: #SEC's Twitter Got Hacked! 🚨
So, the SEC's Twitter got yeeted into chaos, and some rando dropped a tweet bomb! 🐦💣 Remember, the SEC hasn't greenlit any Bitcoin ETPs yet, fam.
Wanna stay crypto-savvy? Don't just scroll past, tap that link! 🧠#Crypto
🚀🌕