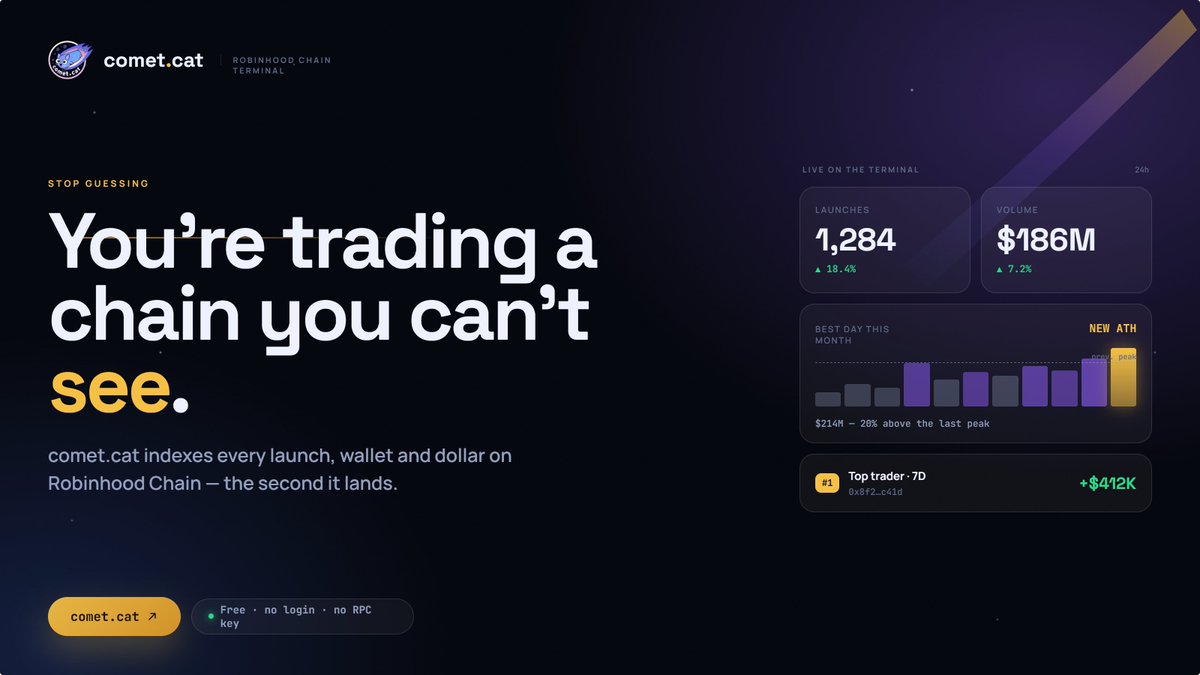
$COMET is live on Robinhood Chain.
We shipped the terminal first every launch, every wallet, every hour, indexed the second it lands. The token comes after the product, not instead of it.
Same chain we've been watching since block one. Now we're in it.
https://t.co/m7IneUck00
Notice: The ARC Chain bridge has been temporarily paused until the network comes back online.
All bridge operations are currently unavailable. We will share updates as soon as service is restored.
Everyone wants alpha. Almost nobody wants a dashboard.
But records don't break in a group chat, they break in the data a day that runs 20% past the old high while the timeline is still arguing about last week.
The average trader on Robinhood Chain makes decisions off three things: a chart with no volume context, a group chat, and vibes. Then wonders why the fill was bad.
Here's the uncomfortable part the data that would have saved the trade was public the whole time. Free. Sitting there. Nobody opened it.
A wallet count that's flat while price rips is a warning. A launchpad doing 60% of share on a day total volume dropped 70% isn't dominant, it's the last one with the lights on. Returning wallets going down while new wallets spike isn't growth, it's churn wearing a costume.
https://t.co/hEZR0yl7Fo: how it actually works
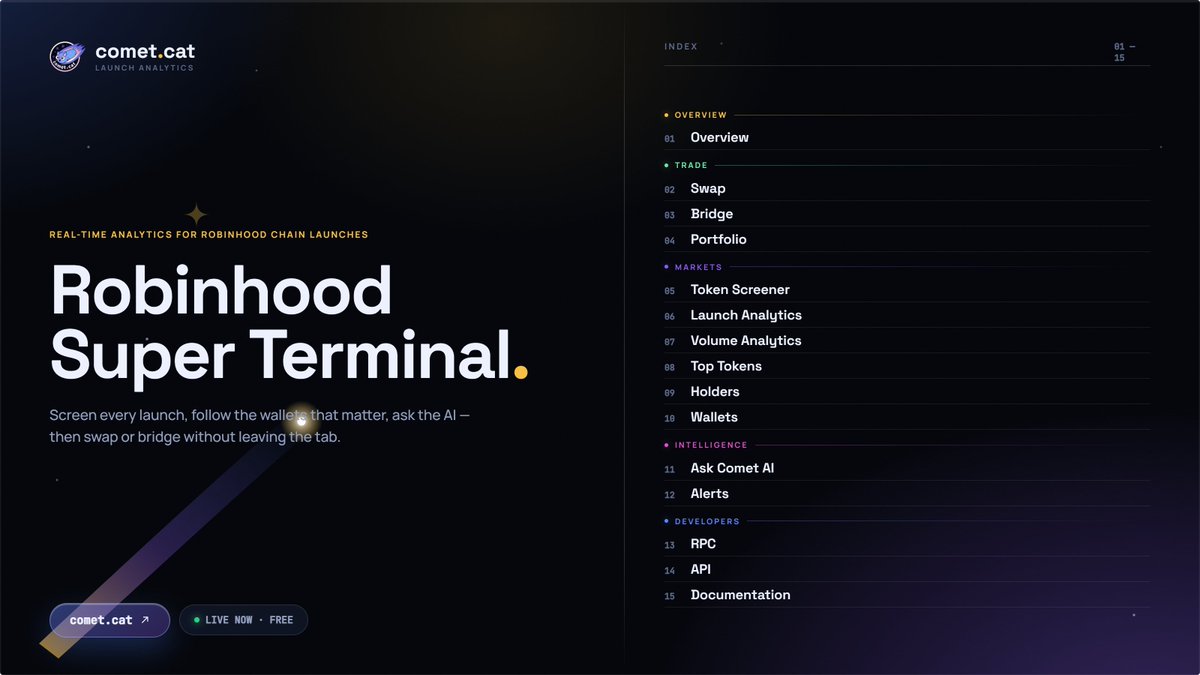
Robinhood Chain ships launches faster than anyone can refresh a block explorer. So we built the terminal for it.
Here's what's running under the hood:
1. Launch indexing, live. Every token that touches a Robinhood Chain launchpad gets picked up the second it lands. Hourly bars, 24H / 7D / 30D views you see the pace of the chain, not a snapshot from an hour ago.
2. Launchpad volume, broken out. Not just a total. Volume per launchpad, stacked and absolute, so you know which venue is actually carrying flow and which one is coasting on a good week.
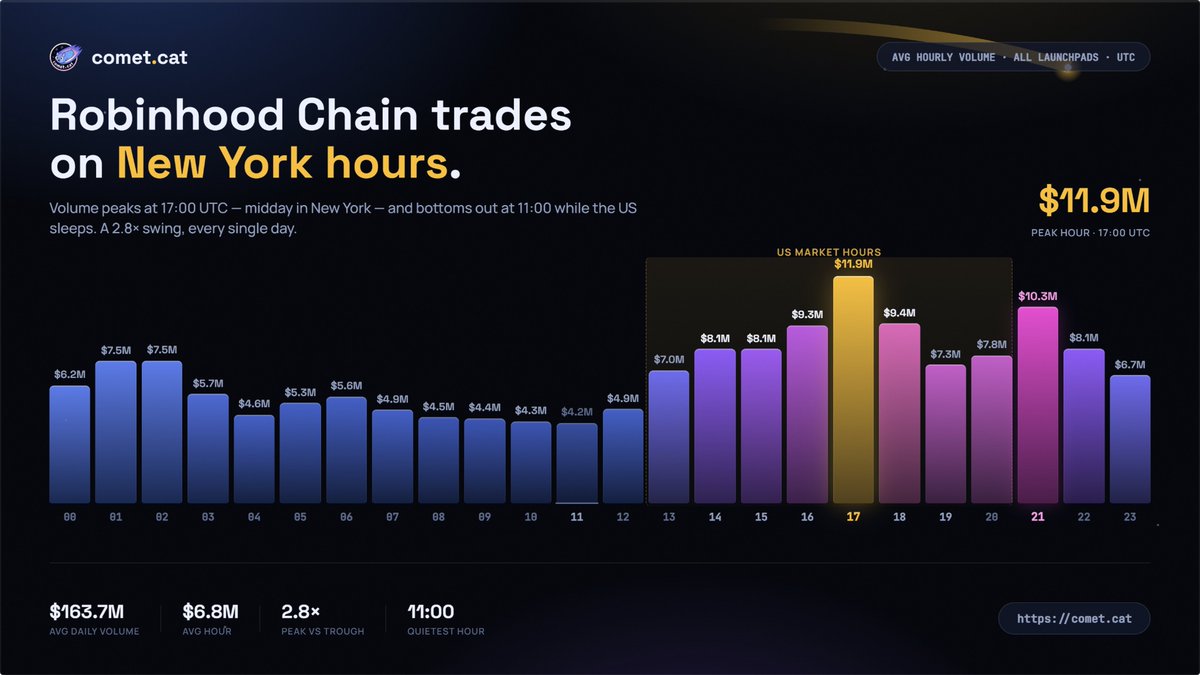
3. Timing data most people never look at. We map volume by hour of day. Turns out activity peaks at 17:00 UTC (~$11.9M) and dies overnight. If you're entering at 04:00 UTC you're paying spread to an empty room.
4. Wallets, not just charts. Active wallets on Robinhood Chain vs Solana vs EVM, side by side. New vs returning wallets split out — the single best read on whether growth is real or just a bot farm cycling fresh addresses.
5. Top traders + KOL scoreboard. Leaderboard by realized PnL, sortable by followers and win rate, with wallet addresses copiable in one click. Follow the money, then verify it yourself on-chain. No screenshots, no "trust me."
6. RWA + trading app metrics. Because Robinhood Chain isn't only memecoins. Real-world-asset volume and app-level activity tracked alongside everything else.
7. Market share, dual view. Share by percentage and by absolute volume on the same card — so a "40% share" week doesn't fool you when total volume halved.
No RPC keys. No spreadsheets. No paid tier.
It's live. It's free. It's one tab.
→ https://t.co/hEZR0yl7Fo
Robinhood Chain has a launchpad problem: the data is all there, and none of it is readable.
So we built https://t.co/m7IneUck00.
Launchpad volume and share. Top trader wallets by realized PnL. KOL positions. The hours the chain actually trades.
One page. No SQL. No signup.
You're trading Robinhood Chain at the wrong hour.
Avg launchpad volume, by hour:
Peak 17:00 UTC — $11.9M (NY lunch)
Second 21:00 UTC — $10.3M (after work)
Launch at 09:00 UTC and you're launching into an empty room. 2.8x swing. Same shape every day.