$SNOW
The price has broken above the monthly resistance zone and is currently retesting it. Last Thursday we saw a prominent long lower wick, which shows bulls stepping in to defend the level.
If it holds, $340 looks highly probable.
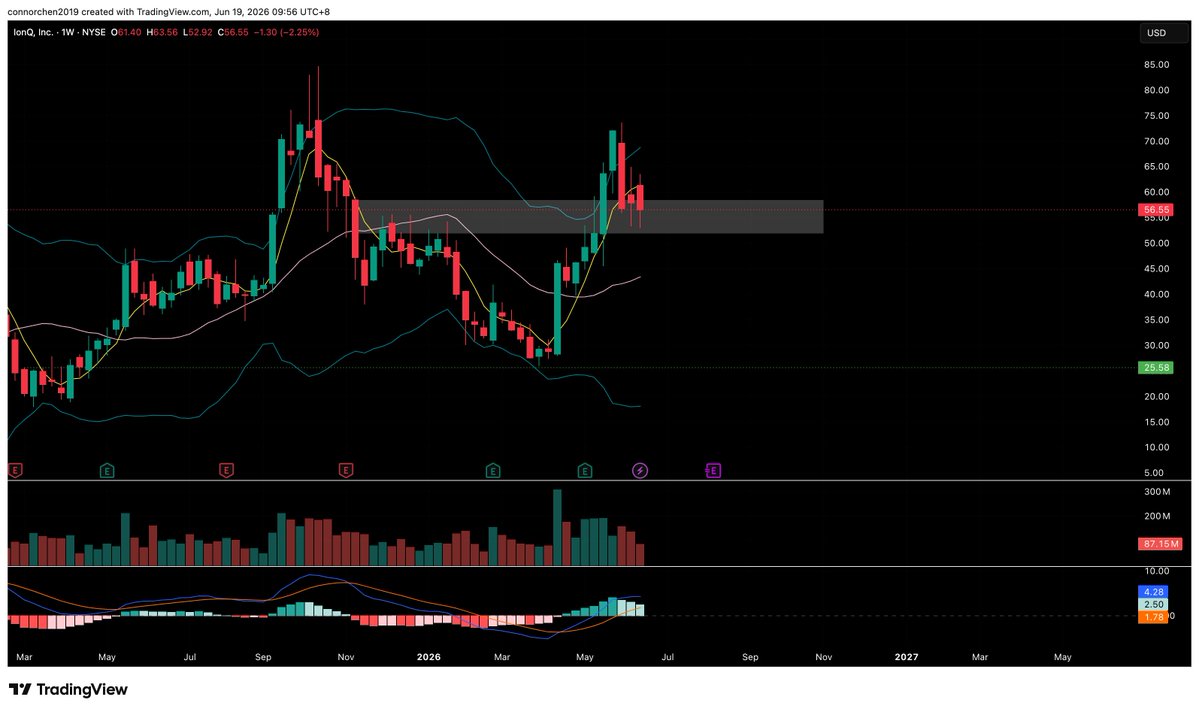
$CRWV
Weekly chart is showing a textbook inverse head and shoulders with a double bottom at the head. Price has already been rejected by the resistance zone 3–4 times and is gearing up for the 5th test.
This resistance level also happens to be the neckline. If it breaks cleanly, we’re likely to see a nice bull run in the coming months.
$ZETA is currently sitting at an important support level for the bulls.
The price touched the middle Bollinger Band on both the weekly and monthly timeframes and bounced nicely from there, right on cue.
$ZETA
Long lower wick on today’s candle — buyers defended this level aggressively.
The green support zone on the daily chart also coincides with the neckline of the inverse head and shoulders.
MACD is hovering just above zero, signaling that bullish momentum may keep building.
@TheRonnieVShow I’m holding 4 of them — they’re all excellent companies.
Love your content, Ronnie. Your zetachain:native analysis has been really helpful and educational.
$CRWV
Weekly chart is showing a textbook inverse head and shoulders with a double bottom at the head. Price has already been rejected by the resistance zone 3–4 times and is gearing up for the 5th test.
This resistance level also happens to be the neckline. If it breaks cleanly, we’re likely to see a nice bull run in the coming months.