Thanks, I am not trying to be malicious. Just asking the next questions. I am always looking for the next edge, whether it was realizing the price is just a facade or that market dislocations come from compression of the correlations, I just want to grind down to the basic maths
Hey RFK, do you have some magic oil or peptides or crystals to give children suffering hearing loss, neurological issues thanks to measles? What's your prevention strategy in the absence of vaccines, huh?
One way we know vaccines work? Take them away and watch what happens.
Hi Samantha. Thanks for your reply. I follow your posts quite regularly. I have developed a set of models that looks at sets of financial instruments and uses information-theoretic methods and information geometry to look at the underlying correlations, their phase states, and interactions, not the price facade. DM me if you are interested in more details.
I have also hard-coded some of the lessons from the book "The Psychology of Intelligence Analysis" while adding additional notes from people like Marko Papic to sharpen (i.e., keep me out of most of the rabbit holes) my Macro analysis
This chart is a clean empirical anchor for the fiscal dominance thesis. The math is damning in a specific way. The 7.7% debt CAGR vs 4.5% nominal GDP CAGR isn't just a gap; it's a diverging exponential. Debt-to-GDP isn't stabilizing at a high level; it's compounding toward instability at roughly 3.2% per year faster than the economy.
Over 25 years, that's not a policy problem; it's a structural attractor. The interest expense at 6.7% CAGR is the transmission mechanism; it's the gap closing between "we owe it" and "we're bleeding it."
This chart is the fundamental justification for your GLD/UUP Net Transfer Entropy sign flip to trigger. When the market prices fiscal dominance, not just discusses it, gold breaks out in real terms against the dollar simultaneously. Watch for that sign flip as the confirmation that the regime has shifted from "concern about deficits" to "deficits are now the monetary regime." Those are very different market states.
The "who finances it" question is deeply connected with Simplify's PFIX ETF as a investible play. The statement "increasingly the Fed through money printing" is precisely why PFIX earns its carry cost. If foreign central banks are buying gold instead of Treasuries, the marginal buyer of duration disappears, term premium rises, and the long end steepens without the Fed's permission. That's the bear steepener scenario PFIX was built for.
The Japan carry trade and the presented chart are the same sentence Read together: Japan stops recycling trade surpluses into Treasuries (Yen carry trade unwind) + foreign central banks pivot to gold (this chart) = the demand side of the Treasury market hollows out from both directions simultaneously. The "who finances it" answer becomes the Fed, which is inflationary, which is also why having commodity names alongside rate hedges isn't crazy.
The chart stops at the present. The acceleration matters more than the level. If the interest expense CAGR is now running above 6.7% (it likely is, given the rate reset from 2022-2024 rolling into higher-coupon debt), the actual current trajectory is worse than what's shown. Worth checking the CBO's latest 10-year window.
Not investment advice, just personal opinion
Is it too early to call the bottom in gold? Probably yes; but the setup is getting interesting.
$4,000 held. Short-term downtrend broken. And the breakout is happening alongside oil moving higher and war escalating. The dominant narrative has been:
↑ Oil → ↑ Inflation → ↑ Rate expectations → ↓ Gold
But maybe the market is waking up to something else.
Trump wants the U.S. to have the lowest interest rates in the world. He didn't pick a Fed Chair to hike rates during the most consequential war since WWII. If that narrative is cracking; if the market is starting to price rate suppression instead of rate hikes, then gold isn't going down because of inflation. It's going up because of it. Watch the $4,000 level. That's the line.
My analysis: Renardo Green is the #2, but it's genuinely contested. The Schur partition exposes why this question is live right now:
Green enters camp as the incumbent, but Jack Jones, Nate Hobbs, and rookie Ephesians Prysock are all "chomping at the bit" to supplant him. The 49ers deliberately created this pressure. Shanahan made clear the intent: "Where you are in trouble is if I'm never challenging you and I'm never getting on you... I have much higher expectations for him than that."
The Ranking:
Renardo Green: he has the upper hand as the better talent than Jones, and Prysock is a rookie. Green won't have much to worry about with Jones. But his seat is hot.
Nate Hobbs: most of his $3.5M contract is guaranteed, giving the former Raider and Packer a leg up on a roster spot, and he's the frontrunner for the "big nickel" role. His run-defense grade is elite (77.4) but his coverage has never recaptured his 79.1 rookie grade.
Jack Jones: A natural ball hawk with surprising run-defense (77.7 PFF), but his volatility in coverage is why he remained on the market until April.
Upside calls: Prysock is the true wild card; at 6'4" and 196 lbs with a 4.45 40-yard dash, he uses his length effectively and has the capability of smothering receivers in zone coverage. The rookie floor concern is real, but his 4.45 40-yard dash, 39-inch vertical, and 33-inch arms are exceptional measurements.
Well since you are putting your prediction out there, here is mine
Mike Evans 2026 Prediction: Schur-Conditioned Analysis
The Data Matrix
Observed 2025 (injury-degraded, 8 games):
Evans started in 8 games and registered 30 receptions for 368 yards and 3 touchdowns; on pace for roughly 64 rec / 784 yds / 6 TD over a full 17-game season. That's the raw signal, but heavily discounted by a degraded system (no Purdy synergy yet, Tampa Bay late-career context).
San Francisco 49ers
Purdy's WR1 reference template (Aiyuk 2023): Aiyuk and Brock Purdy formed perhaps the most efficient QB/WR duo in the league in 2023, with 105 passes producing 75 catches (71.4%) for 1,342 yards (17.9 YPR) and 7 touchdowns. That's the Purdy WR1 attractor state ; the ceiling eigenvalue for what his system produces when the WR1 slot is fully occupied.
Purdy's accuracy profile:
Purdy's on-target percentage was 74.4%, with catchable passes at 89.7%. This is elite-tier QB accuracy, and Evans is literally the textbook high-catch-radius target.
Schur Partitioning
Think of this as two Schur complements operating in sequence:
Gate 1: Evans's own signal conditioned on 2025:
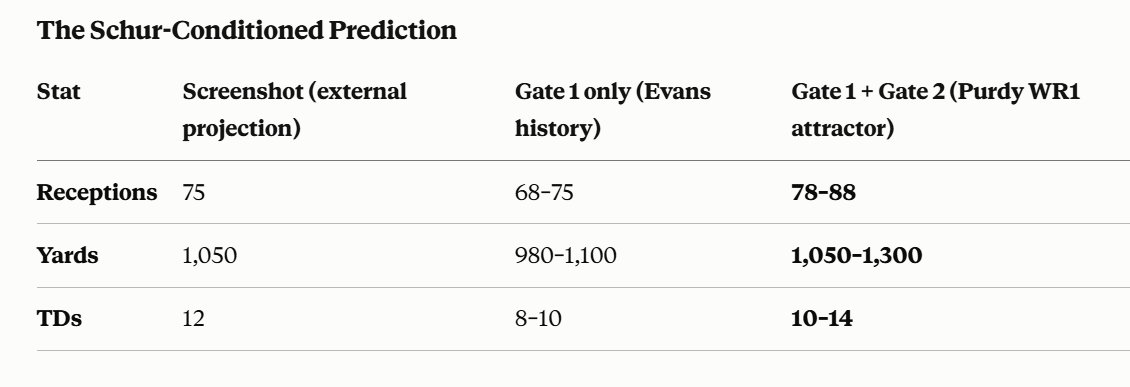
The 2025 data (8/17 games, new system, injury), is a little bit flawed if he is healthy. The "true Evans" subspace lies in his 11-year history: consistent 1,000+ yd seasons. The 2025 degradation is a noise eigenvalue, not the structural one. Evans surpassed 1,000 receiving yards in each of his first 11 NFL seasons before falling short in 2025 while limited to a career-low 8 games. His rate stats (YPR ~13–18) have been stable. Projecting forward from his healthy-season attractor: ~75 rec / 1,050 yds / 9-10 TD. That's the image shown in your screenshot, and it's essentially the mean of his healthy-season distribution (see Yahoo Sports)
Gate 2 — Purdy's WR1 attractor (Schur complement conditioning):
Now condition additionally on what Purdy's system does to a WR1. The Aiyuk 2023 template gives us:
Target share to WR1: ~105 targets
Catch rate: ~71%, YPR: ~17.9 (deep threat profile)
Evans's YPR is typically lower (13–15) than Aiyuk's (a speedier deep threat), but his catch rate in a favorable scheme should be higher (size, precise route runner). Shanahan's movement-heavy system also adds manufactured separation. The more you see how Evans was used last season, the more obvious it becomes that Kyle Shanahan will move him around the formation; Evans is superior to what Jennings did/does at the line of scrimmage and at the top of his route.
Additionally: Evans is a guy that, if you want to do stuff like that with one- and two-yard touchdown passes, he's more than capable, meaning Shanahan's red zone scheming should inflate Evans's TD count relative to his Tampa days.
The Schur-Conditioned Prediction (see Table at end of post)
The key Schur insight: Coach Yac's 75 rec / 1,050 yds / 12 TD is internally consistent with Gate 1 alone (Evans's historical mean). But when you additionally condition on the Purdy WR1 eigenstate (Gate 2), the yardage and reception ceiling opens up; because Purdy's system systematically produces ~1,050–1,340 yds from his WR1 slot when healthy, and Evans is a better catch-radius target than the system average. The 12 TD figure actually becomes the floor in the fully-conditioned model, since Shanahan's red zone packaging is elite and Evans has historically over-indexed TDs relative to yardage.
My Schur-conditioned central estimate for 2026:
82 REC / 1,150 YDS / 11–13 TD
with a health-dependent upside of 90 rec / 1,300 yds / 14 TD (the Houshmandzadeh ceiling estimate, which he placed at 1,300 yards, 87–92 catches, and 11–14 touchdowns if Evans plays all 17 games).
The one risk eigenvalue: Age 33 in 2026, and the 2025 injury was soft-tissue related (not just a single acute event). If he misses >3 games, the whole distribution collapses toward the 2025 truncated sample. Conditioning on 16+ games played, which the OTA reports suggest is likely (Evans is making a strong impression at voluntary OTAs and feels rejuvenated after an injury-plagued 2025), the central estimate above holds.
The 12 TD projection is the boldest number and the one most sensitive to Shanahan's red zone design. Given what Shanahan did with Davante Adams comparables and Kittle at the goal line, it's defensible, but the mean outcome is probably 10–11 TDs with right-tail upside to 13–14.
This preprint claims a 13-Sharpe out-of-sample equity factor. The idea is genuinely good. The Sharpe number is almost certainly wrong.
The regime-gate concept- only trade stocks with >60% up-days in 63 days- is underexplored and interesting. But the backtest tests 3 cherry-picked bull-market years out of 20, uses current S&P 500 constituents (survivorship bias ~30-50% Sharpe inflation), assumes 0.6bp transaction costs on a 42%-daily-turnover strategy (real cost: 2-5bp), and sits on a parameter knife-edge where shifting the threshold ±30% collapses Sharpe from 13 → 3.
Corrected estimate: Sharpe 1.5–2.5 net.
Still worth knowing about. Not worth trading until someone runs it on a point-in-time universe across all 20 years with realistic costs. The idea survives. The Sharpe number doesn't.
You are right... here is the evidence for and against
Scientific Evidence vs. FBI/IC Assessment — and Where Fauci Sits
Part I: The Scientific Layer-by-Layer Tomography
Layer 0 (Heuer/Diagnosticity): What does the evidence actually discriminate?
The most diagnostically powerful scientific evidence is the Huanan Market spatial data. Raccoon dogs, civets, bamboo rats, and other SARS-CoV-2-susceptible wildlife were documented being illegally sold in the west wing of the market in late 2019; the same zone where the earliest and majority of market COVID-19 cases worked. Critically, wildlife DNA was identified in all SARS-CoV-2-positive samples from that stall, including species such as civets, bamboo rats, and raccoon dogs previously identified as possible intermediate hosts.
Apply diagnosticity here rigorously: this co-localization of susceptible wildlife DNA with SARS-CoV-2 positivity at the same stall is genuinely discriminating evidence. It is consistent with zoonotic, inconsistent with lab leak as an origin at that specific location. A lab leak origin would predict the market as an amplification site only, not as a co-location of susceptible animal reservoir and viral signal.
Further, phylogenetic evidence supports at least two sustained zoonotic spillovers of SARS-CoV-2 into humans, with both lineage A and lineage B linked to the market. Two independent spillover events at the same market location is nearly impossible to reconcile with a lab leak scenario; a single accidental release wouldn't produce two genetically distinct lineage introductions both clustering geographically at the Huanan market.
SARS-CoV-2 is the ninth documented coronavirus to enter the human population, and the best existing scientific evidence supports a direct zoonotic origin — with ample historical precedent across common-cold coronaviruses, SARS-CoV, Ebola, HIV, and influenza.
Layer 1: What is the organizational D-block quality of scientific reviewers?
The WHO-convened SAGO group concluded the evidence strongly supports the zoonotic spillover hypothesis; with three of four original SAGO members who did not sign the final report doing so in protest of the inclusion of the lab leak hypothesis at all, which they claimed lacks any evidence. These are domain experts; virologists, epidemiologists, evolutionary biologists, with high-rank diagnostic blocks in the exact relevant eigenspace.
Layer 2 (Hidden Machinery): Is there an engineered signal obscuring the true system?
Yes; and this is crucial. Chinese CDC reported none of the 457 animal samples tested positive for SARS-CoV-2, but 73 of 923 environmental samples tested positive. The absence of direct animal positives after market closure is not the same as absence of infected animals before closure; the Chinese authorities closed the market and sanitized it before comprehensive live-animal sampling could occur. This is a source suppression event: the data-generating node was removed before the measurement could be made. Absence of evidence here is not evidence of absence' it's evidence of a data pipeline that was shut down.
This is the Hidden Machinery layer's most important contribution: Chinese non-cooperation doesn't favor lab leak. It suppresses the zoonotic evidence chain equally or more severely than it suppresses lab leak evidence, because the animal reservoir evidence would have been at the market, which China controlled and sanitized.
Part II: The Fauci Gain-of-Function Question — Running the Same Tomography
This is where the analysis gets genuinely complex, because there are two separable questions that Rand Paul deliberately conflates:
Question A: Did NIH-funded research at WIV constitute gain-of-function?
Question B: Did that research cause the pandemic?
These are logically independent. GSAF Tomography requires we keep them in separate CLM blocks.
On Question A; the definitional dispute:
Richard Ebright, a professor of chemistry and chemical biology at Rutgers University and a longtime critic of gain-of-function research, has said that the EcoHealth/WIV research "was; unequivocally gain-of-function research." Ebright is not a political actor — he is a credentialed molecular biologist with longstanding biosafety concerns predating COVID. His D-block is high-rank on this specific question.
NIH's own Deputy Director Tabak, under congressional questioning, acknowledged that under the generic definition of gain-of-function, NIH did fund such research at WIV through EcoHealth; while clarifying that the generic term covers research conducted in many labs across the country.
Fauci repeatedly testified that NIH/NIAID did not fund gain-of-function research at WIV, while acknowledging NIH funds flowed to EcoHealth Alliance and through it to WIV; maintaining the funded program's stated aims were surveillance and characterization of bat coronaviruses, not deliberate enhancement experiments.
Running the Heuer ACH matrix on this:
The definitional dispute is real and not purely political. In October 2021, NIH updated the definition of gain-of-function research to focus more on enhanced pandemic potential pathogens, meaning much of what was previously considered gain-of-function research fell outside the scope of the stricter oversight required for enhanced potential pandemic pathogen studies. This mid-stream definitional shift is the core of the Rand Paul accusation, and it's not without foundation. Whether it constitutes deliberate cover-up vs. legitimate regulatory evolution is the diagnostic question Paul cannot answer with the evidence he has.
On Question B — the causal chain to the pandemic:
None of the documented EcoHealth/WIV work was on the pandemic coronavirus itself. Anyone who claims the documents show the WIV is responsible for the current pandemic is at best severely misinformed. This is the critical Heuer diagnostic point: the gain-of-function debate and the pandemic origin debate are not the same eigenvalue. Paul Rand consistently conflates them in public; which is either a genuine confusion or deliberate rhetorical strategy.
Part III: The Comparative Verdict (see table at end of post)
Where the Evidence Lies on Fauci Specifically
Fauci was likely technically correct that the NIH-funded work did not meet the regulatory definition of gain-of-function as applied at the time; the chimeric coronavirus experiments used bat viruses not classified as pandemic pathogens under the operative 2014 framework.
Fauci was likely epistemically sloppy in his categorical Senate denial. A more honest formulation would have been: "Under our operative regulatory definition, no, but I acknowledge there is a legitimate scientific debate about whether the broader generic definition applies." His flat categorical denial gave Rand Paul the rhetorical leverage he needed.
The "cover-up" accusation fails the diagnosticity test because it requires the additional claim that the funded research caused the pandemic;and that causal chain is not established by any evidence currently in the public domain, and is made less plausible by the animal co-localization and dual-spillover evidence from the Huanan market.
The Tomography summary: Fauci navigated a genuine definitional ambiguity imperfectly, in a politically charged environment, using a categorical denial that was technically defensible but rhetorically fragile. Rand Paul exploited that fragility by conflating Question A (gain-of-function definitional dispute) with Question B (pandemic causation); a deliberate diagnostic partition violation. The FBI assessment amplified this conflation without the diagnostic tools to adjudicate it.
Zoonotic remains the better-supported hypothesis, Fauci's gain-of-function statements were imprecise but not demonstrably dishonest, and the "deep state cover-up" framing fails every layer of the Tomography test.
@goodbyeLMJ@Coach_Yac Don't disagree, but outside of CMC look at Shanahans results with running backs, especially rookies in year 1. I hope for the best but plan on probabilities
A ;liitle more depth...eveyone is judging Deebo as a WR!/2... but he could be a CMC insurance node.
CMC's stiffness (η≈0.91) comes from his triple-coupling: he's simultaneously wired into the RB eigenvector, the slot/check-down receiver eigenvector, and the pass protection eigenvector. That's why his Schur complement removal is so damaging: three functional channels lose their primary node simultaneously. He's essentially a 3-in-1 node, which is why SF's GINI jumped to 0.79 when he was even partially absent in 2025.
Now lets run the question: who in SF's current 2026 CLM covers all three channels if CMC goes down?
Isaac Guerendo: legitimate RB, but minimal receiving pedigree and no blocking η to speak of. Covers one channel.
Mike Evans / Kirk: cover the WR eigenvector fine, but none of them run routes out of the backfield or block in pass pro. Zero cross-coupling into the RB channel.
Trey Benson (if signed), Jordan James, depth RBs, same problem as Guerendo.
Nobody in SF's current roster covers all three channels simultaneously. There's a genuine CMC-void gap, and the stiffness drops from η=0.91 to a patchwork of single-channel nodes, none above η≈0.55 on the combined three-eigenvector metric.
This is exactly where Deebo's dual-mode coupling becomes structurally irreplaceable. At his peak he was the only receiver in the league who ran routes out of the backfield, took jet sweeps, and could be used as a runner on designed plays; genuinely coupling into both the WR and RB eigenvectors.
Even at his 2026 realized η≈0.60, he covers two of CMC's three channels: the receiving-out-of-backfield channel and the designed-run channel. No other available free agent does that. Kirk covers one. Evans covers one. Neither blocks like Juice or Deebo has.
So the corrected LESG assessment: Deebo isn't a WR buffer node addition; he's a partial CMC redundancy node, which is a much rarer and more valuable structural role. The fact that SF already has Evans and Kirk in the WR tier actually makes Deebo more valuable, not less, because the WR tier is covered and what's missing is precisely the cross-channel coupling he uniquely provides.
At $6–8M he moves SF's CMC-void vulnerability from critical to manageable. That's the right framing for why Kittle and Juszczyk want him back; they know instinctively what the Schur complement confirms: nobody else on the roster routes through the backfield the way Deebo does.
The market is undervaluing him specifically because it's slotting him as a WR3. He's not; he's a CMC depth node, and those don't grow on trees.
I don't disagree, but the 49ers are still a potentially brittle team, injury-wise (just look at 2024 and 2025 and one of the oldest offensive lineups in the NFL). If CMC goes down, then which back is catching the ball 2nd or 3rd down...a new rookie (not Shanahans stye) or Jordan James, maybe, Isaac Guerendo... still a developmental piece?). We know Deebo can run block and catch... it's all about preparing for the injuries
Good analysis, but it misses some crucial points
The NFC West health post misses the actual target. It's not about who got hurt; it's about what the injury did to the system. I ran availability-weighted Schur complement partitioning on every roster, backing out intrinsic positional value (η) conditioned on the rest of the team CLM ( a way to look at the collection of team stats via the individual stats), then computed the LESG ( Local Environmental Softness Gradient) across positional couplings. Here's what the math actually says.
🦅 SEA (LESG gradient 8.6, brittleness 1.7): textbook antifragile construction. Zero FI∩K voids all season. JSN (η=0.97), Darnold (0.93), Leonard Williams (0.91), Witherspoon (0.88), and Ernest Jones IV (0.75) all active.
The critical structural feature everyone missed: Jones at η=0.75 occupies the exact middle tier, an intermediate-stiffness coupling node between the elite layer and the depth layer. That's what creates steep LESG gradients at every tier. Kupp, Lawrence, and Walker form a genuine soft buffer below (η=0.55–0.72). When any node took a hit, the system rerouted. GINI concentration = 0.39. Super Bowl wasn't luck. it was the only structurally antifragile roster in the division.
🐏 LAR (LESG 5.6, brittleness 4.9): conditionally brittle. Stafford (η=0.96) and Nacua (0.95) are both FI∩K rigid core nodes. Verse and Young give you real pass rush depth. The hole is below Stafford: LESG(QB→backup) is nearly flat, depth η≈0.34.
The Kupp departure to Seattle is the key structural event; Kupp had historically been the WR buffer node absorbing Stafford output variance. Adams (η=0.78) partially fills it. GINI = 0.59. The Rams ran on elite performance and got within a touchdown of the Super Bowl. The math says NFC Championship is their ceiling until that depth layer gets rebuilt.
🏈 SF (LESG 2.1, brittleness 9.4): sequential void cascade. This is where the framework earns its keep. Preseason η profile looked loaded: Williams (0.88), Bosa (0.88), Warner (0.85), CMC (0.89), Kittle (0.88). But availability-weighted η tells the real story. Bosa tears his ACL in Week 3 → η collapses to 0.12. Warner goes on IR → 0.14. Trent Williams misses multiple games, listed Q/out for the Divisional round → 0.20. Aiyuk starts on PUP from a 2024 ACL → 0.22.
By the time they faced Seattle in the Divisional, four of their eight highest-η preseason nodes were at near-zero. GINI jumped to 0.79 as all functional output concentrated through Purdy, CMC, and Kittle. The LESG restoring gradient on the defensive side of the CLM had completely vanished. The 41-6 score isn't an upset; the Schur complement predicted it.
⚡ ARI (LESG 1.8, brittleness 9.1) — double-void collapse, distinct failure topology from SF. Murray (foot, IR Week 5) and MHJ (concussion, appendicitis, bilateral heel injuries, IR) voided simultaneously. Their availability-weighted η: Murray 0.16, MHJ 0.29. What's left: McBride at η=0.88; genuinely elite, but isolated. In Schur complement terms, losing the QB node simultaneously decouples every other node from the QB-WR eigenvector. It doesn't matter what McBride's intrinsic η is; with no QB node to couple through, his FI contribution collapses to near-zero regardless. Brissett (η=0.52) is a flat plateau, not a staircase step, he creates no LESG gradient above him. GINI = 0.81, highest in the division. The 3-14 record is the direct empirical signature. Note: this is structurally different from SF's cascade. SF lost nodes sequentially from a deep pool. ARI lost both identity-defining nodes simultaneously from a shallow pool. Same catastrophic output, completely different Schur topology.
Bottom line: depth isn't depth unless it exists at every tier of the stiffness hierarchy. Seattle built a hetero-geneous η distribution across four tiers and maintained it all season. Every other team either concentrated talent into a few rigid nodes with no buffer layer (SF), ran on elite star performance without systemic redundancy (LAR), or lost the two nodes that defined their entire offensive eigenvector simultaneously (ARI).
The robustness-fragility paradox holds: the 49ers had more individual star power than Seattle and finished the Divisional round giving up 41 points. The system that wins isn't the one with the highest η nodes ; it's the one with the steepest LESG gradient across all of them.
So for the 2026 season, the match suggests ( and I hope it is wrong):
2026 NFC West — LESG ranking
1. Los Angeles Rams — LESG trajectory: ascending
The Rams are the most structurally interesting story in the division. They acquired Defensive Player of the Year Myles Garrett from Cleveland and cornerback Trent McDuffie from Kansas City. In LESG terms, this is a targeted void-fill: the 2025 analysis identified LESG(QB→backup) as flat and pass rush depth as the real brittleness risk.
Garrett doesn't fix the QB buffer, but he transforms the defensive CLM; adding a η≈0.95 node to a pass rush that had Verse as its only rigid core. McDuffie patches the secondary void Darnold exploited for 346 yards in the NFC Championship. Stafford, Nacua, Verse, and Adams all return. GINI drops toward 0.52. This is the team that deliberately studied the 2025 Seahawks blueprint and paid for specific buffer nodes. DraftKings has them favored at +100 for a reason.
2. Seattle Seahawks: LESG trajectory: slight gradient erosion, still antifragile. The championship core is mostly intact; JSN, Darnold, Leonard Williams, Witherspoon, Ernest Jones IV all return. Klint Kubiak left for the Raiders head coaching job, and Kenneth Walker III departed in free agency. Zach Charbonnet is coming back from a late-season injury, and first-round pick Jadarian Price will handle Walker's workload.
In LESG terms: Walker was a mid-tier buffer node (η≈0.55); replaceable by design. Charbonnet + Price preserves that tier. The more meaningful hit is Kubiak; OC departures don't map cleanly to CLM nodes, but they do increase Darnold's variance, which affects the QB stiffness estimate. New OC Brian Fleury is installing a similar system. The five elite nodes that won the Super Bowl are untouched. Still the most heterogeneous η distribution in the division.
3. San Francisco 49ers: LESG trajectory: recovering, but watch the sequence. The 49ers are healthier in 2026: Fred Warner, Nick Bosa, and George Kittle are all returning from injury. They signed Mike Evans on a deal and also added Christian Kirk.
In LESG terms, this is the most significant structural shift in the division. The 2025 CLM void pattern was almost entirely injury-driven: Bosa, Warner, and Williams. With all three returning to active status, the preseason η profile re-inflates toward 2024 levels. The question the framework asks: is the buffer layer deeper now?
Evans adds a genuine WR1/2 node (η≈0.75), Kittle and CMC remain elite, but Persall and Stibling are still unknowns. If the injury pattern doesn't repeat, SF's CLM is legitimately dangerous. If it does repeat, and the 2024 and 2025 seasons both show a pattern of cascading multi-player absences, the LESG flattening risk is structural, not random. The robustness-fragility paradox hasn't been solved, just reset.
4. Arizona Cardinals: LESG trajectory: identity reset, longer rebuild than the odds suggest. Kyler Murray was released in March after the foot injury that ended his 2025 season never properly healed. MHJ missed five games and ended on IR. New head coach Mike LaFleur is installing his offense with Jacoby Brissett as the presumed starter, though Brissett skipped voluntary workouts seeking a contract raise.
In LESG terms: the double-void from 2025 hasn't been resolved, it's been rebranded. Brissett (η≈0.52) replaces Murray as the QB node, which actually improves availability-weighted η relative to 2025 (Murray's effective η was 0.16 on the season), but creates no gradient above him. McBride remains the one legitimate high-η node. MHJ's realized η in 2026 is the pivotal unknown; if healthy he re-establishes the WR1 coupling, but he's going into 2026 not yet fully recovered from bilateral heel injuries. The Cardinals at +10,000 reflects the market's correct read that this is still a one-and-a-half-node CLM.
The LESG verdict: The conventional market ranking (LAR, SEA, SF, ARI) is correct but for the wrong reasons. The Rams lead not because Garrett and McDuffie are flashy acquisitions, but because they specifically targeted the two CLM voids the 2025 analysis identified: defensive pass rush depth and secondary brittleness.
That's what makes it structurally sound rather than just expensive. Seattle holds second because the antifragile staircase architecture is intact at every tier that matters. SF is the highest-variance team — full recovery means a genuine Super Bowl contender; a third consecutive cascading injury season means another early exit. ARI is a 2027 story.