Real estate development, investor, weather enthusiast and family man.
My only account has a blue checkmark. Beware of impersonators.
No investment advice!
THREAD // How I Invest
1. Successful Investing starts with Education
2. Psychology of Trading & General Rules
3. Essentials of Fundamental Analysis
4. Master Technical Analysis
5. Screening for Stocks
6. Making a Watchlist
7. Money Management
8. Diversification of Accounts
It took me 48 years to get here, as a native NY'er.
Excellent slice.
Naughty: Spicy Vodka Sauce (contains Prosciutto), Pepperoni, Fresh Mozzarella, Whipped Ricotta, Zab's Hot Honey
Prince St. Pizza
ThePupOfWallSt
I guess you never heard back from that guy
$MBLY with its lowest closing since April 2026 and down 54% from that tweet exchange. They are still bag holding almost 2 years later.
$MNTN - $10.08, the recent drawdown has taken it back to the 200d ma.
This is an ideal area to add if you like the stock. Pyramid into the stock, to reduce downside risk.
I see Burry cut his large loss in $LULU as it continues to make new lows.
He's still holding his $NVDA short as it made a new all time high.
Stocks aren't credit default swaps with large leveraged gains.
🤷♂️👀
Results since selling these 4 stocks from the long term portfolio last November:
$JPM +9.5%
$WMT +2.5%
$HD -22.4%
$NFLX -39.3%
$NFLX is in a major stage 4 drawdown.
What appears low can go a lot lower
$NKE
Stay away from stage 4s!
The stock was already down 57% and then proceeded to drop another 54% since.
Let a base form so the odds increase significantly.
Simple as that.
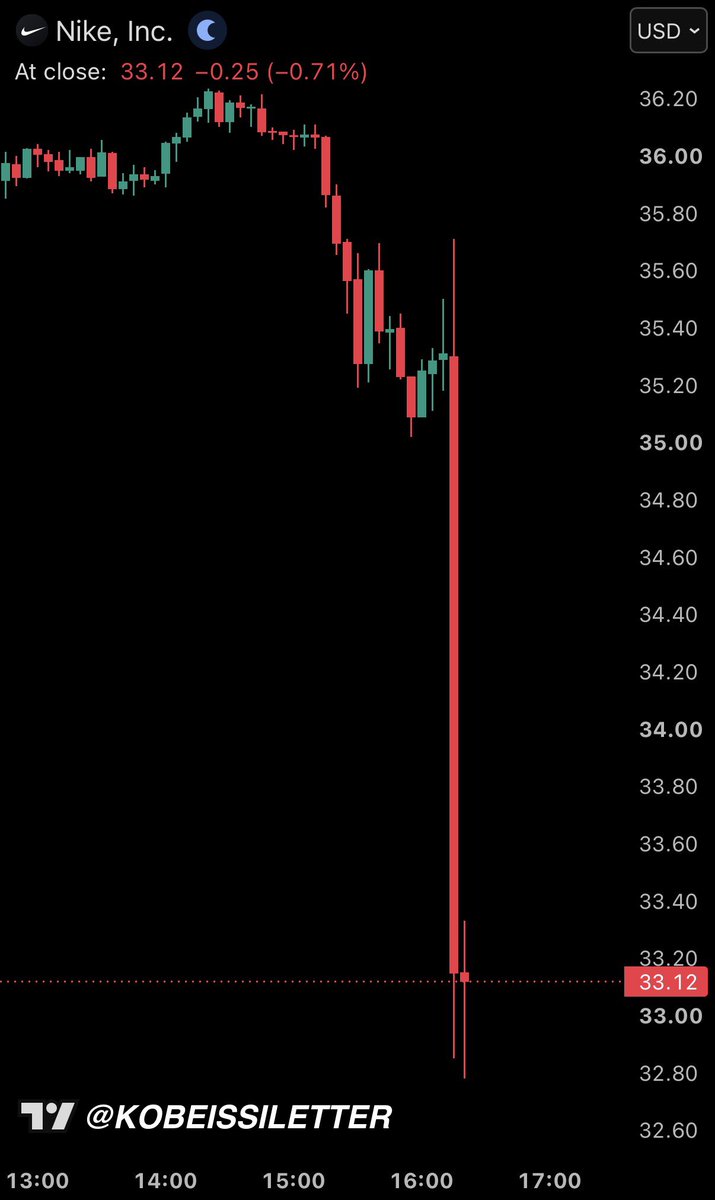
BREAKING: Nike stock, $NKE, crashes another -6% to its lowest level since September 2013 after posting weaker than expected earnings.
The stock is now down -82% from its record high, erasing -$230 billion in market cap.
Less than half of all stocks on the $SPX are now trading above their own 200d ma.
Clear divergence between the handful of leaders and the S&P 500 breadth.
Only 31.58% of all stocks on the $COMPQ are trading above their own 50d ma.
The divergence is quite obvious on the chart = index holding near highs while breadth weakens.
Only 25.4% of all stocks on the $SPX are trading above their own 50d ma.
Quite a divergence from the market's action, being held up by a handful of leaders.