#1 $BE
This is easily in my top 5 stocks I'd like to own and ride.
Weekly 9EMA tap like it saw in the past before a big move up.
Two false moves.
And the most recent one ends up playing out.
Sir- this a 400 dollar stock.
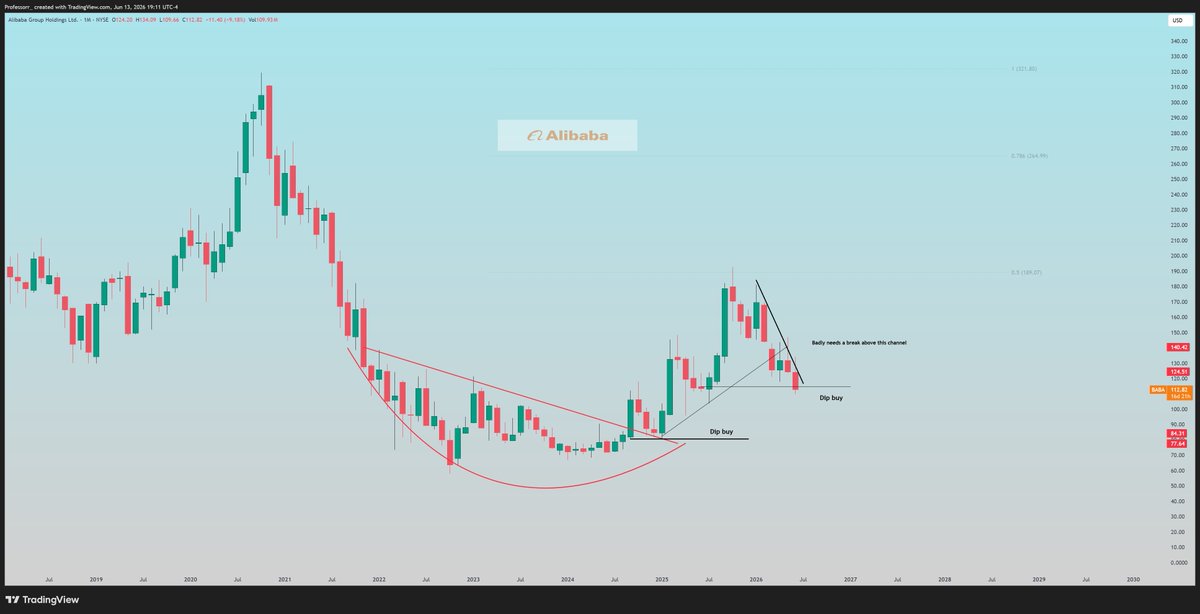
#2 $BABA
China names have been very weak in 2026. And very unhappy with their performance.
For Alibaba it is sitting at Dip buy level but I would be avoiding it here. In this case you want to buy strength not weakness.
Needs a break above 132 to break this downtrend curse.
Thats the only level that matters.
#3 $CLS
I have a long memory. And alway giving out ideas.
Did a chart fest a year ago and wrote about $CLS.
Jul 6: $159
June 2: $475
190% higher.
What's happening now?
Another weekly breakout and the end target it is gravitated towards is at 550.
#4 $MRAM
One of my fav lines "On momentum plays you enter when momentum starts not before"
Stock is testing weekly 9EMA, held horizontal support.
The momentum you want picked up after 28,
An easy 40-50% move once it breaks.
#5 $OKLO
I strongly suggest everyone to learn about stage analysis.
Stage 1- Accumulation
Stage 2- Mark-Up
Stage 3- Distribution
Stage 4- Mark-Down
Repeat.
Oklo is between Stage 4 & 1.
Save this one. Every stock does this.
This recent market wide pullback has created many generational dip buying opportunities.
These are the best 8 names to buy now:
1. $IREN at $59
2. $NOW at $102
3. $ASTS at $82
4. $RKLB at $104
5. $NVDA at $205
6. $CIFR at $24
7. $NBIS at $230
8. $PLTR at $127
Don’t miss out on these setups before they’re long gone…
#6 $PLTR
On Palantir
I am long term bullish
but accepting this medium term Bearish look
Bounced 25% off the President's buy signal but lost it all.
Most likely going to 100-110 next whhich will be a very attractive level to be a buyer at.
Long term investors accumulate on dips.
Thats what they're supposed to do.
#7 $AMAT
I am a long term holder. And will remain invested from $140.
My view here is $1000 in 2027.
All 10-20% pullbacks are buys.
#8 $LRCX
No position but same view-All dips are buys.
As long as nothing changes fundamentally- this stock will hit $500
#9 $OSS
One interesting stock which is making all the right moves.
If you're fortunate to see a dip to 12s- you take it.
#10 $VST
Going into 8 months of consolidation period and has yet to break above my channel.
Once it breaks this downtrend- you add
Maye need more time here.
#11 $USAR
Nothing to do here but wait. Rejection at resistance and big support level at 20, then at 16.
#12 $MP
Prefer this over others just because its more mature and has done well technically thru ups and downs.
Also pressed under resistance and would need to break above 65 to get the move we'd want to see here.
#13 $UUUU
Same look here as well.
Came down and held the April 2025 AWAP. May see small bounces but dont expect a WOW type move here.
#14 $IDR
This one would be second best here.
Very controlled pullback and whenever rare earth stocks go this will give 50-70% move in a timely fashion.
In a nutshell- the whole theme is going thru a pullback, consolidation phase. Nothing good is happening here.
Momentum will eventually pick here and when these stocks clear the shared resistance lines -you want to be there.
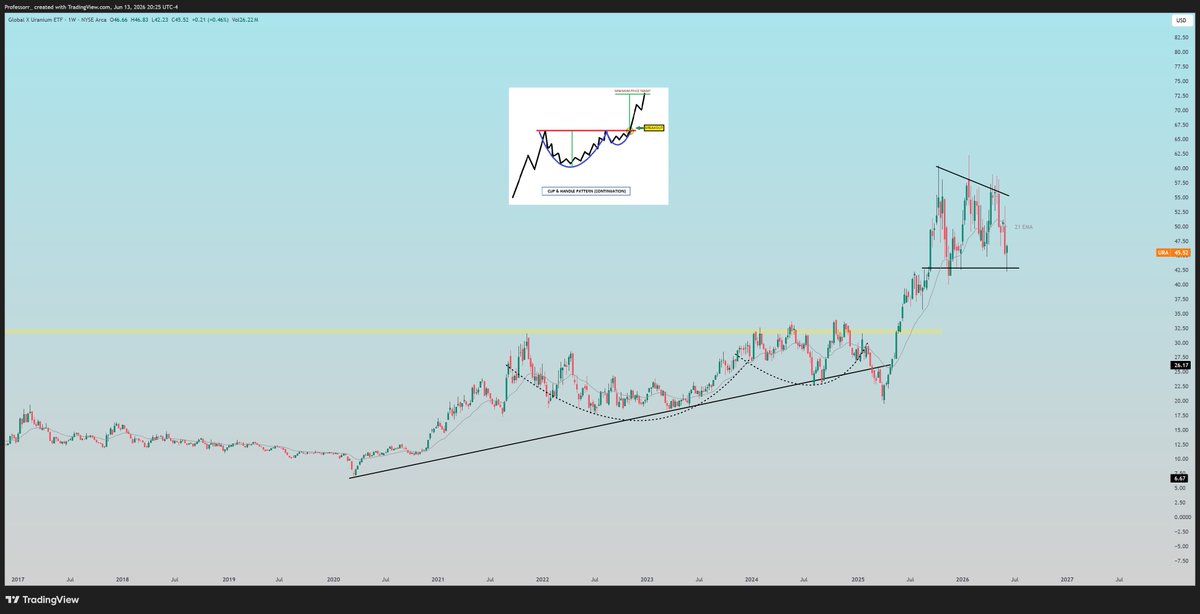
Uranium Theme is getting overlooked.
#15 $URNM
If there was ever a time to look at Uranium - it is now.
Uranium ETF tested $50 support line- HELD.
#16 People know I have $CCJ in long term account. That also tested support and held.
#17 You have $URA which where we nailed a 80% move and its going thru normal long term consolidation.
#18 And the last one $UEC just did something which everyone should be watching and jumping off the chair for
Tested previous all time highs. 😳
I expect Uranium stocks to be 100-150% higher. Thats not even up for debate.
And you can trade Uranium but make sure you have room for it in your Long term account as well.
$SPY $QQQ $AIQ $RSP
THE TWO MOST IMPORTANT CHARTS THIS WEEKEND 📈
$AIQ The Global Artificial Intelligence & Technology ETF vs The $RSP Equal Weighted S&P ETF
This is something most people are not paying attention which have shed light on the last few weeks
In the first chart is the ratio of $AIQ vs $RSP ONE YEAR, the 2nd chart is the same ratio but SIX YEARS
On the ONE YEAR chart you can clearly see that the current pullback has brought this chart right back to the penny of the “Neckline” (Support/Resistance Area) from which it broke out. This is classic Technical Analysis that once there’s a base breakout there’s often a retest and a good point of entry is at the former high where it looks to turn previous resistance into current support 🧐
So far we can see clearly on the chart that it had reacted to that level and started to base above that neckline
The ensuing move is often a leg higher that matches the size of the initial leg that led to the breakout above
The 2nd chart is the SIX YEAR version of the $AIQ vs $RSP ratio chart
You can see that this was a SIX YEAR base that it broke out from which often has a very strong multi multi month if not multi year move when coming out of a base that took 6 years to form… as the saying goes “the longer the base, the higher the space 🚀”
You can see where I drew in “dark green” what’s called the measured move as it is basically the size of the approximately the low point of this base to the neckline and that distance is added above the neckline as the potential measured move. Nothing happens in a straight line so we are having a pullback as it has clearly been working towards the measured move - to which we already “zoomed in” on the shorter ONE YEAR a period as discussed above
The reason both these charts are so important is because it captures the global theme as we’re in a literal industrial technology Revolution of the strongest technology humans have ever created, and we keep hearing pundits and arm chair technicians on social media and financial TV tell us that we’re in an AI bubble and that the markets are going to crash every week and the top is in 🤦♂️🤦♂️🤦♂️
This chart shows scientific proof that it took a long time for this theme to form and then emerge and after a 6 year breakout the chances of the top already being in as far as this chart is concerned is premature 😉
This analysis and chart is also key because pretty much NOBODY has it or is looking at this as they just look at the $SPY $QQQ or some individual names to determine the end all be all factoids of this market. This analysis and chart is a deep dive under the hood for what’s really driving this market and the GLOBE, how we got hear, and what’s been happening since. This is a much more robust analysis and shows why certain AI stocks performed the way that they have once we broke out of the SIX YEAR base and how we’re maybe only half way into the measured move. 📝
When you think about all that and the way earnings and fundamental metrics have broken out in particular AI stocks - then the lightbulb in our heads goes off versus just calling things parabolic or bubbles. There’s nothing parabolic in this chart as it took more than half a decade to get to where we are 😘
I always dive deeper under the hood of the markets
I hope you enjoyed the read
Much love! 💜🍌🍌🍌
One of these stocks could shock the market over the next two decades:
$HIMS
$IREN
$NOW
$NBIS
I believe a future trillion dollar company is somewhere on this list.
Bookmark this.
$RKLB (June 14, 2026-weekly chart)
Yellow Candles have been incredibly accurate on $RKLB’s historical trends.
It typically takes 5–7 weeks of sideways consolidation or a healthy pullback before the next bullish candle appears. Will this time be different? Are you patient enough to hold through the volatility?
What does these four companies have in common?
They are the world's top Semiconductor Equipment Manufacturers. These guys don't make the actual chips, they build the machines that allow major chipmakers to design and fabricate microchips.
(Thread 🧵)
$AMAT $ASML $KLAC $LRCX
TRUMP:
- SIGNING DEAL WITH IRAN TOMORROW
- STRAIT OF HORMUZ WILL BE OPEN TO EVERYONE
- LOOKING FORWARD TO WORKING WITH THE ENTIRE MIDDLE EAST
bro saved the deal signing for his birthday 😂