Love a good #AMA? Next week, we've got an exciting one with @rperry_ talking about #Grafana Pyroscope: https://t.co/U49Bj0wD9g
What We’ll Cover
🧩 The Observability Puzzle: Go beyond logs and metrics to pinpoint root causes at the code level.
💰 Cost-Saving Stories: Learn how companies saved $1M+ by catching inefficient code in seconds.
👋 Hands-On Demo: Watch #Profiling in action and see how easy it is to start with Grafana Cloud.
Bring your questions!
¡Acabo de tener la peor experiencia con @LycamobileES! 🤯Pésima atención al cliente. Me han hecho gastar 30m hoy por teléfono solo para intentar modificar la dirección de envío de mi pedido. Y en vez de modificarla, ellos eligieron cancelarlo aunque les especifique que no. 👎🏾👎🏾
Por algún extraño misterio, cuando otros medios citan el trabajo de @Civio, de repente se convierte en un “estudio”. ¿Por qué? | 📩 31ª entrega de 'Civio en bruto': https://t.co/eJAScHSuhe
@martinprins "Bref, on peut dire ce qu’on veut de l’histoire du monde, tout ce qui peut venir à l’idée de la cervelle la plus dérangée. La seule chose qu’on ne puisse pas dire, c’est qu’elle est raisonnable." - Les Carnets du sous-sol, Dostoïevski
🚀 Introducing a new "explore profiles" UI inside Grafana! Now you can explore continuous profiling data a more intuitive, user-friendly interface. Dive into performance bottlenecks with ease using our queryless experience for faster insights!
https://t.co/NKkxNvLtvk
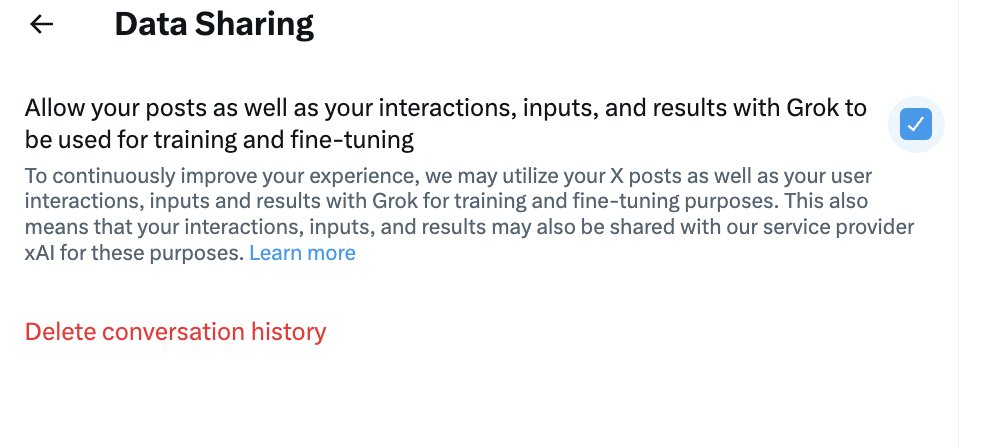
Without notice, X has opted all users into training its "Grok" AI Model. To turn off this setting and stop your "posts, interactions, inputs, and results" from being used for training and fine-tuning Grok, visit https://t.co/hhKe2I8u9d and uncheck the checkbox.
📺 Upcoming webinar on July 24: Getting started with continuous profiling with Grafana Cloud Profiles
Learn the basics of continuous profiling and see a live demo on how to use Grafana Cloud Profiles to optimize an application for the lowest latency.
https://t.co/addN71N0Jq
@dannykopping@grafana Thanks! Indeed, we're already looking into it: synchronizing the y-axis could help, but also using bar gauges/histograms to show the resource consumption per label, for example. Much more coming soon!
🎉 Today we're also introducing Explore Profiles, which provides a smooth, queryless experience for you to browse and analyze your profiling data.
Explore more! https://t.co/GEMYgkMZ3k