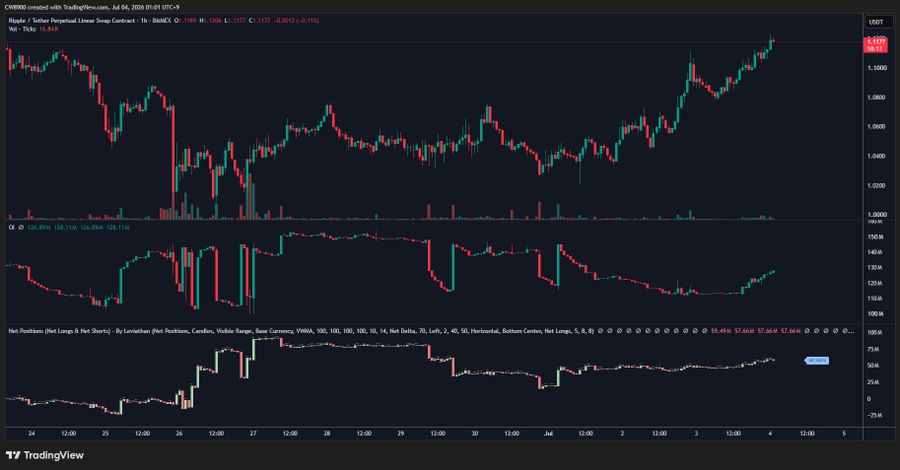
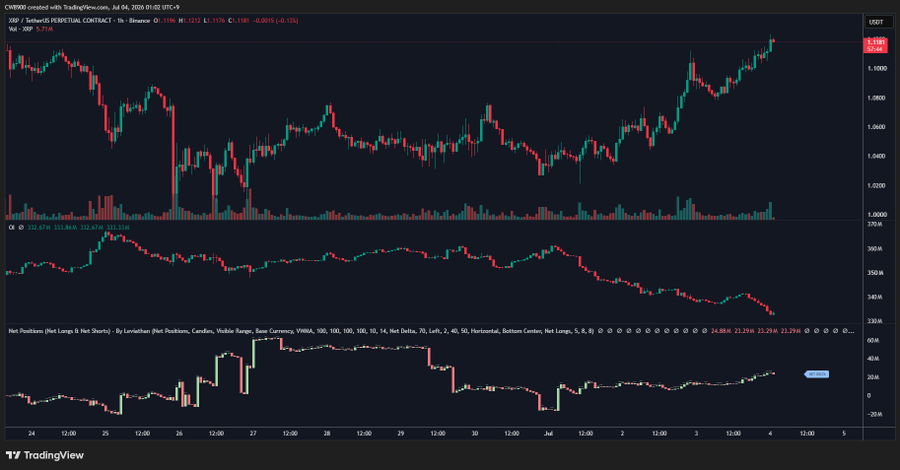
XRP is currently exhibiting a shift in the long-short structure of the derivatives market: bullish sentiment remains strong on BitMEX, whereas open interest on Binance has declined—potentially indicating short liquidations or position unwinding. Should buying pressure return to Binance and bring in fresh capital, a combination of short covering and renewed momentum could drive an accelerated short-term rally; however, the market is currently in a phase where bulls hold the upper hand but require confirmation from new capital to sustain the trend, and whether the upward movement expands will depend on subsequent trading volume and the strength of capital inflows.
XRP continues to face pressure near a key diagonal trend line; the price is slowly edging up above the $1.00 support level and approaching the $1.13–$1.15 resistance zone, exhibiting a structure characterized by "gradual convergence" and "liquidity compression." A decisive daily close above $1.15 could open the door for a move toward $1.35—though until the breakout is confirmed, this zone acts more like a high-volatility trap where bulls and bears battle for control—whereas a failure to hold the $0.98 support level would invalidate the current reversal structure and push the price back into a downtrend.
Bitcoin received a short-term boost as the Federal Reserve reaffirmed its 2% inflation target, with its price reclaiming the $60,000 level; meanwhile, Ethereum strengthened to above $1,600 and gold approached $4,050, reflecting the market's complex sentiment in pricing both risk assets and safe-haven assets. Despite the currently positive price reaction, prediction markets remain divided over the prospect of another rate hike in 2026, indicating an ongoing tug-of-war between "improving real-world signals" and "future policy uncertainty," with overall market trends driven by a combination of expectations and data.
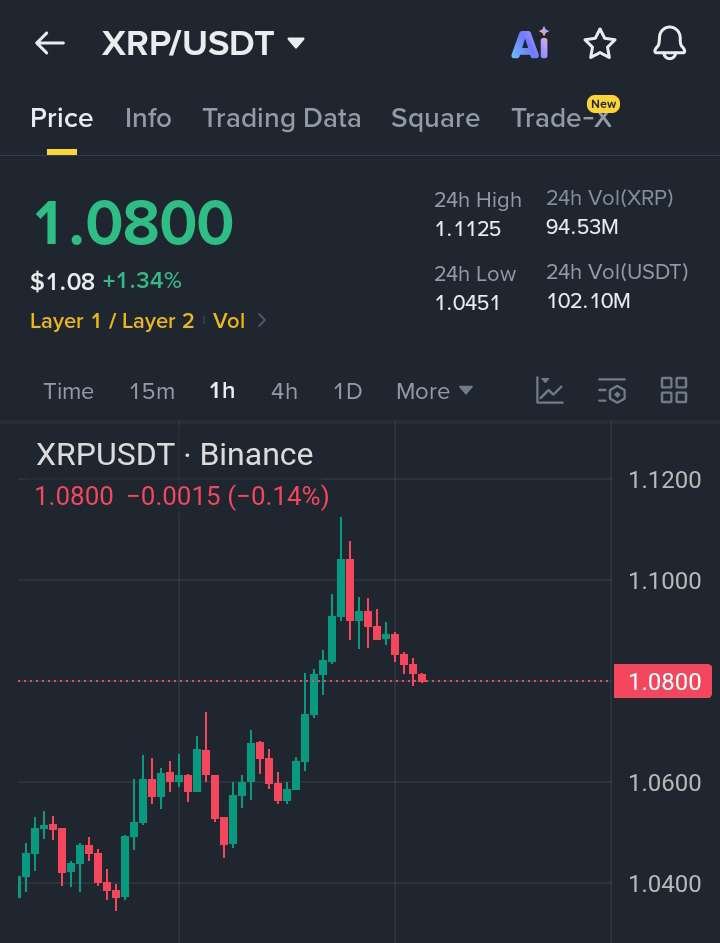
Following a rally, XRP has entered a consolidation phase above a key support zone, with its short-term price action characterized by consolidation at elevated levels while awaiting confirmation of the next direction. If buying pressure successfully defends the $1.075–$1.085 support band, the asset could extend its upward momentum to test resistance levels around $1.10, $1.12, and $1.15; however, a drop below the $1.060 stop-loss level would signal a failure of support, potentially causing the short-term trend to weaken again. Overall, the market remains in a post-rally consolidation phase, with the future direction requiring further confirmation.
XRP has returned to the dark pool liquidity zone above $1.07943, indicating that the price is testing the order book area that was previously suppressed. If buying can continue to absorb the trapped selling pressure above and turn this range into support, the short-term structure is expected to strengthen, opening up room for further upward movement. The key resistance zone is concentrated around $1.18–$1.36. However, it is still necessary to confirm whether this breakout is supported by sustained trading volume; otherwise, it may just be a consolidation phase following a liquidity sweep.
Current positions in XRP, Ethereum, and Bitcoin remain in profit, with unrealized gains totaling approximately $746,000. Overall performance is strong; the strategy favors continued holding and patience while awaiting the achievement of established targets or further market confirmation of the trend.
🚨🇺🇸 $30 TRILLION CLARITY ACT 🇺🇸🚨
Senator Tim Scott says the $30 trillion CLARITY Act should be completed this July.
Clear rules will unlock the next wave of institutional capital into digital assets.
For Ripple and XRP, this will be one of the biggest regulatory milestones yet.
On the 4-hour timeframe, XRP is currently oscillating around the $1.03–$1.05 support zone. If this area holds, it indicates sustained buying interest, potentially triggering a short-term rebound to test resistance levels at $1.08, $1.12, and even $1.18. However, a drop below the $0.99 stop-loss level would signal a failure of support, likely leading to a deeper pullback. Consequently, the market remains in a "support-testing phase," with the direction contingent on whether buyers can maintain momentum within this critical range.
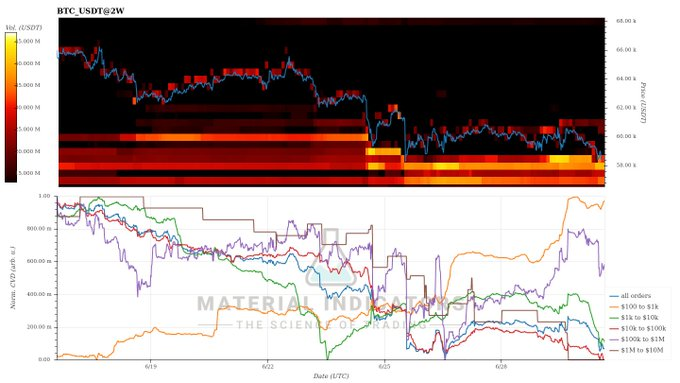
Bitcoin is currently seeing a significant rise in short positions, with the market betting on a drop toward the $55,000 level; however, this structure of "extreme consensus on shorting" inherently increases sensitivity to a reversal: should key support hold or a rebound occur, short covering could trigger a rapid rally—though the possibility of the downward trend continuing cannot be ruled out. Overall, the market has entered a phase characterized by "polarized sentiment and crowded positioning," meaning the true direction will depend on liquidity and the fate of key support levels, rather than any single sentiment indicator.
Bitcoin's current structure exhibits the classic on-chain distribution pattern of "retail selling met by whale accumulation": as prices decline, retail investors continue to sell, while large holders ("whales") accumulate positions in key buying zones, thereby establishing potential support. Historically, this pattern often appears at interim bottoms or the onset of a rebound; however, whether a genuine trend reversal is underway depends on whether this buying zone can be successfully defended and an upward trend structure re-established. Overall, this represents a "divergent accumulation phase" rather than a confirmed trend reversal.
Bitcoin’s historical cycles do exhibit certain "monthly seasonal" patterns: while performance tends to be weaker in May and June, the probability of a rebound in July increases in some statistical samples; however, this pattern is inconsistent and does not hold true across every cycle. From a market logic perspective, such phenomena are driven more by liquidity cycles, the recovery of risk sentiment, and institutional rebalancing rather than by any fixed rule. Consequently, while these patterns can serve as a gauge for market sentiment, they should not be used in isolation as a basis for trading decisions; the ultimate price trajectory depends on factors such as macro liquidity, ETF capital flows, and the stabilization of key price structures.
Discussions are underway regarding the introduction of a native lending mechanism to the XRP Ledger (XRPL) that would enable banks and financial institutions to secure financing using tokenized assets as collateral—without selling the underlying assets. This system would facilitate on-chain loan origination and repayment while maintaining compliance and security frameworks, with credit approvals handled off-chain; the proposal currently awaits approval from XRPL validators. Overall, this upgrade concept leans toward "institutional-grade DeFi infrastructure," aiming to strengthen the XRPL's capabilities in tokenized finance and banking-grade lending scenarios, though it remains in the proposal stage and has not yet been officially implemented.
The change in XRP's net position is rebounding, signaling a renewed buildup of long positions and a shift in trader sentiment from caution to cautious optimism. However, such data typically indicates a "revival in market participation" rather than a confirmed trend; a clearer upward structure would only likely emerge if the price subsequently breaks through key resistance on high volume—otherwise, this could simply be a short-term sentiment recovery or a positional adjustment amidst range-bound trading.
Current bullish views on XRP—centered on massive corporate accumulation, a $3 price target, and the onset of an altcoin season—are primarily driven by market sentiment and narratives rather than concrete data on capital inflows or institutional buying. Actual price action remains largely dependent on broader crypto market liquidity and technical structures; consequently, such predictions reflect sentiment-based assessments rather than a proven price trajectory.
XRP is currently in a critical "contraction and consolidation phase," with the price oscillating between support and resistance levels near 1.04, showing no clear short-term trend. Structures on the 4-hour and 2-hour charts indicate narrowing volatility, typically signaling that the market is accumulating liquidity in preparation for a significant breakout. The 1.02–1.01 zone below is viewed as a key demand area; if the price retraces to this level and holds, it could rebound above 1.04 or even push toward 1.10. Conversely, a decisive breakout above 1.04 or a drop below 1.01 would trigger a directional move. Overall, the market is in a "wait-and-see" phase regarding the breakout; both bulls and bears are gathering strength, and the next major move will depend on which side breaks the key range first and seizes control of the liquidity.
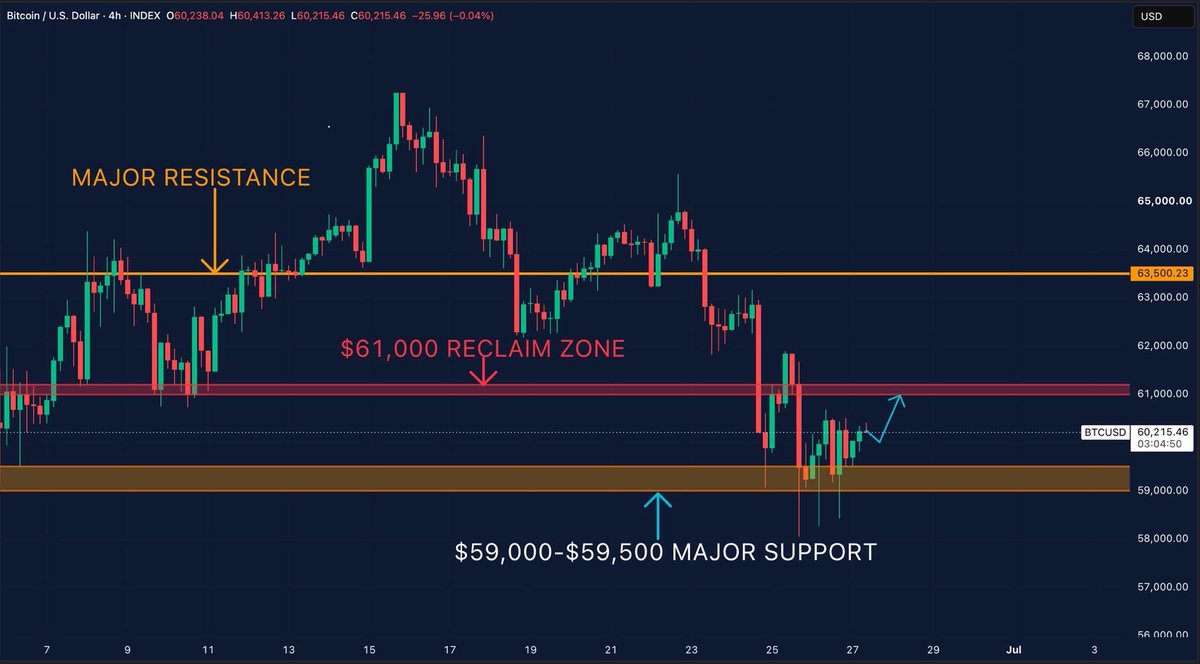
Bitcoin has temporarily stabilized after rebounding from the $59,500–$60,300 support zone but has yet to reclaim the critical $61,000 level; its overall structure remains in a phase of "rebound and recovery without confirmed trend reversal." If it breaks above and holds the $61,000 mark, a further advance toward $63,500 is possible; otherwise, the move may simply be a technical rebound within a downtrend.
On-chain Bitcoin data shows that the net exchange outflow (30-day change) has rebounded from long-term negative territory to above the zero line, indicating that BTC is consistently moving from exchanges to private wallets and suggesting a potential easing of selling pressure. This shift to positive net flow is typically viewed as a signal of a potential transition from distribution (selling) to accumulation (hoarding)—a pattern historically observed when long-term holders gradually absorb supply. If this trend persists, the resulting reduction in exchange-available supply could pave the way for a subsequent price rebound. However, given the prevailing macroeconomic uncertainty, this is best interpreted as a signal of potential structural improvement rather than immediate confirmation of an upward trend.
XRP is testing a key support level around $1.04, accompanied by high volatility and surging trading volume near the psychological $1.00 mark; this indicates heightened short-term market anxiety, with selling pressure and buying interest fiercely contending in this critical zone. Meanwhile, Micron Technology continues to attract market attention driven by sustained demand for AI memory; however, following a significant prior rally, investors have shifted to a cautious "wait-and-see" stance, leading to some profit-taking and increased short-term volatility risk. Overall, both crypto assets and tech stocks are in a divergent phase characterized by "testing key support" versus "consolidation at highs," as market sentiment transitions from one-sided optimism to a state of fluctuation and directional uncertainty.
Bitcoin fell to around $58,000, hitting a near 21-month low, yet the daily close remained above the critical $59,000 support level, indicating that the short-term structure has not yet decisively broken down. Current market sentiment is weak; failure to hold the $59,000 mark could lead to further downward pressure, whereas reclaiming $63,200 would offer a chance to invalidate the bearish breakout and alleviate that pressure. Overall, BTC is positioned in a sensitive zone between critical support and a potential reversal confirmation; its future direction hinges on whether it can reclaim key levels above.
Bitcoin is currently fluctuating around $59,897, positioned at the tail end of a four-week-long descending triangle (an apex compression phase); the overall structure has reached a critical juncture for determining its next direction. While the price has repeatedly found support and rebounded quickly near $58,300, a descending trendline overhead has consistently capped rallies, creating a distinct pattern of convergence. In the short term, the key lies in whether the price can hold the $59,400–$61,400 range and break upward: stabilizing above and breaking past $64,000 would confirm a bullish breakout, opening the way for a move toward the $66,000–$67,000 zone. Conversely, if the price closes below $58,300 on an 8-hour chart, the current structure would be invalidated, potentially leading to a further decline toward the $57,500 or even $55,000 level. Overall, the market is at a point of "terminal compression" and on the verge of high volatility, with the next move set to determine the medium-term trend.