Bitcoin ($BTC) Macro Roadmap: The Path to $180,000? 🚀
The Big Picture:
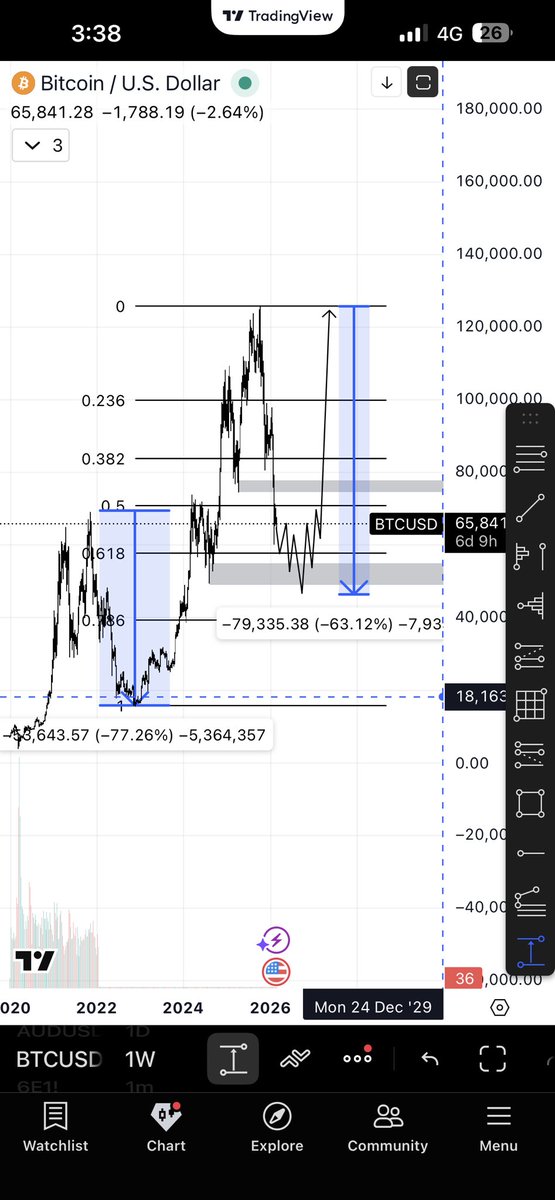
On the 1-Week timeframe, Bitcoin is showing a high-conviction structural setup. We are currently navigating a massive retest of the 0.5 - 0.618 Fibonacci retracement levels, a zone historically known for "Smart Money" accumulation before a parabolic expansion.
Technical Breakdown:
• Fibonacci Golden Zone: $BTC has found significant support in the $45,000 - $60,000 range (the lower gray demand zone). This perfectly aligns with the 0.618 Fib level, signaling a healthy correction within a macro bull cycle.
• Demand Validation: The price is currently oscillating between two key liquidity blocks. Holding above the $65,000 level (0.5 Fib) is crucial for maintaining immediate bullish momentum.
• The "God Candle" Projection: Looking at the measured move from the 2022 bottom, the current fractal suggests we are in the "final shakeout" phase. Once the overhead resistance at $74,000 (previous ATH) is cleared, the Fibonacci extension targets point toward a breathtaking cycle peak of $180,000.
Market Sentiment:
Short-term fluctuations are designed to shake out "weak hands." The macro structure remains intact, and the long-term trend is clearly pointing North.
Strategy:
• Current Phase: Value Accumulation.
• Primary Support: $52,000 - $60,000.
• Macro Target: $180,000 🎯
Are you positioned for the next leg up, or are you waiting for one last dip? Share your strategy below! 👇
#BTC #Bitcoin #CryptoAnalysis #TechnicalAnalysis #BullRun #PricePrediction #BinanceSquare
Since you're looking for a technical look at Bitcoin (BTC), here is a concise breakdown of the current market structure.
BTC/USDT Technical Outlook
Bitcoin is currently navigating a critical consolidation phase. After the recent volatility, the price is compressed between key psychological and technical levels.
Key Levels to Watch
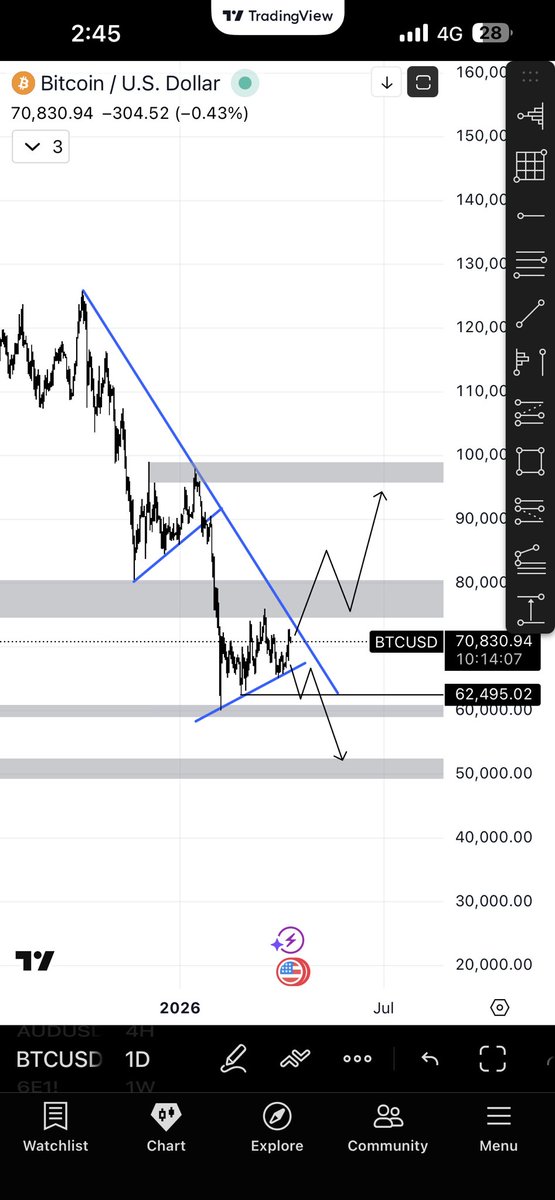
• Immediate Resistance: $72,500 $73,800. A clean break and daily close above this zone are required to confirm a continuation toward new all time highs.
• Major Support: $68,200 $69,000. This area aligns with the 50 day EMA (Exponential Moving Average). Staying above this level maintains the mid-term bullish structure.
• Risk Zone: A drop below $64,500 would signal a shift in market character, likely leading to a deeper correction toward the $60k psychological floor.
Indicators & Sentiment
• RSI (Relative Strength Index): Currently hovering around 55 60, suggesting there is still "room to run" before the asset becomes technically overbought.
• Volume: We are seeing declining volume on the consolidation, which often precedes a high-volatility "breakout" or "breakdown" move.
• Market Bias: Cautiously Bullish. The trend remains upward on the higher timeframes (Daily/Weekly), but short term "washouts" of high leverage long positions are common in this range.
$btc $usdt #btc #usdt