🚨 Keeping an eye on these 💪 🚀
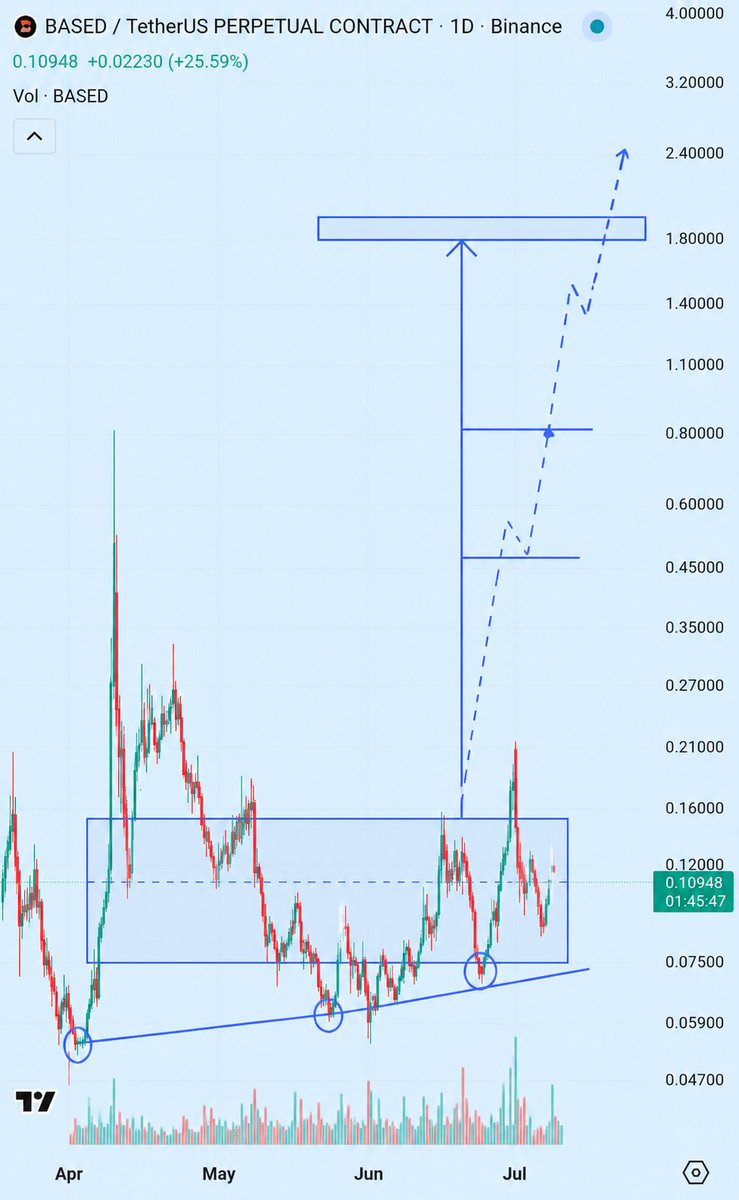
$BASED massive pump coming 🚀 UP ⬆️
$COLLECT massive pump 🚀 UP ⬆️
$IDOL massive pump coming ✅️ 💪
$EDU pump coming 🚀 UP ⬆️
$C pump soon 🚀 UP ⬆️
$FHE pump soon 🚀 UP ⬆️
$LIGHT massive 🚀 UP ⬆️
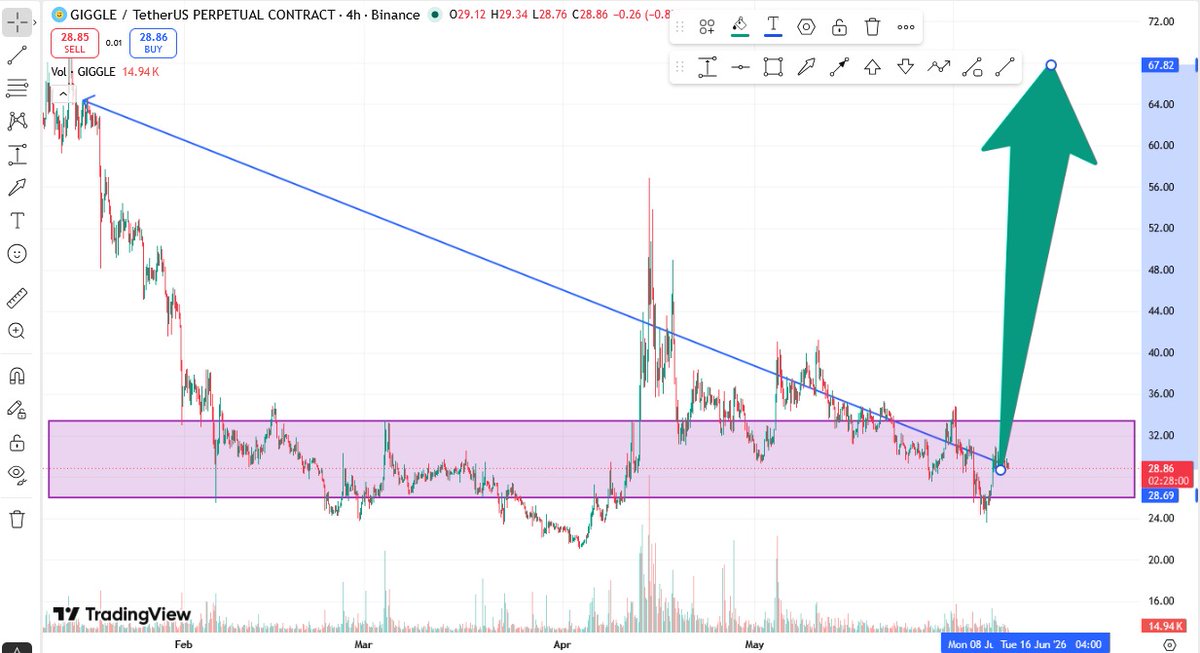
$Giggle massive Pump 🚀 UP ⬆️
$RECALL massive Pump coming ✅️ 💪
Here we go 🚀 UP ⬆️
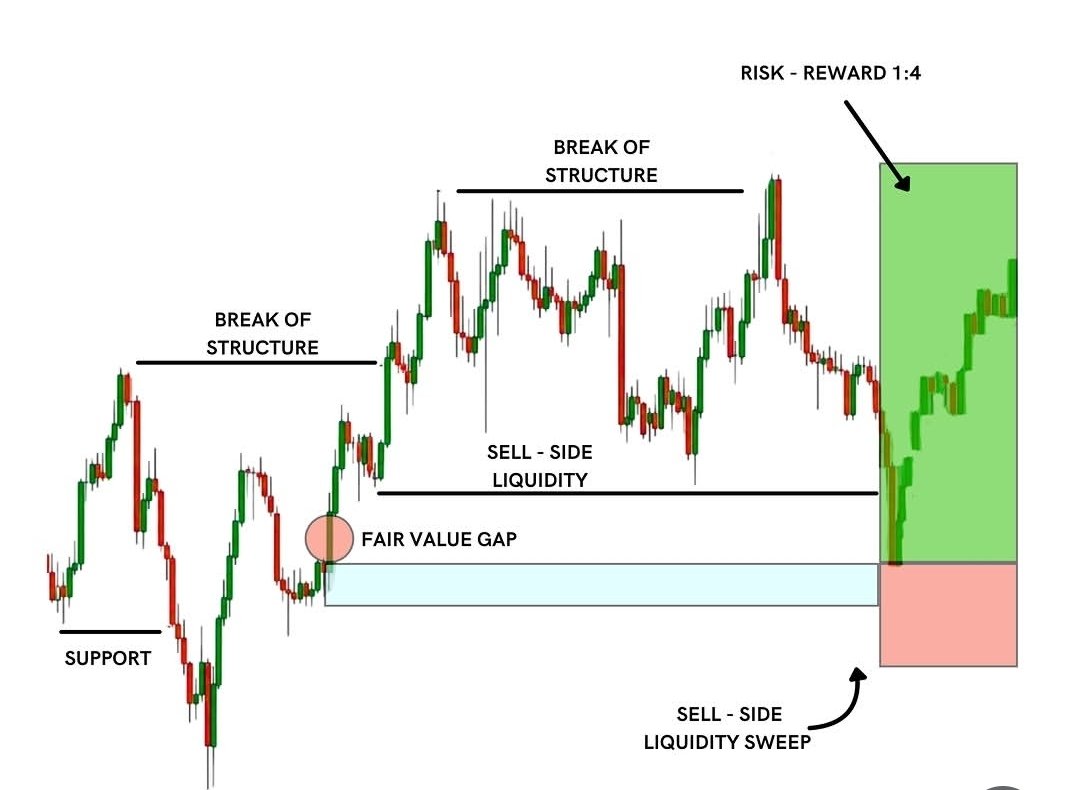
MARKET STRUCTURE MASTERCLASS
✔ BREAK OF STRUCTURE.
Signals a shift in trend direction and potential entry zones.
✔ FAIR VALUE GAP.
Imbalance between buyers and sellers; price often revisits this zone.
✔ SELL-SIDE LIQUIDITY.
Cluster of stop orders below support; smart money hunts these levels.
✔ LIQUIDITY SWEEP.
Price dips below liquidity before reversing sharply upward.
✔ RISK-REWARD 1:4.
High-probability setup with strong reward potential relative to risk.
✍️DOUBLE BOTTOM MANIPULATION – REVERSAL ENTRY SETUP👀👇
✅ SUPPORT – Price forms a clear double bottom structure at a key support level.
✅ MANIPULATION – Price briefly breaks below support to shake out weak hands and trap sellers before reversing.
✅ BULLISH ORDER BLOCK – A strong buying zone (order block) sits just below the double bottom, confirming institutional interest.
✅ RESISTANCE – The neckline or resistance level that price must break to confirm the reversal.
✅ ENTRY – Enter after price reclaims support and shows bullish confirmation, or on a break above the double bottom neckline.
✍️Watch for the fake break below support – that's the manipulation. The real move is the reversal back up.
🚨 STOP HUNT MANIPULATION – TRADE SMART 🚨
✅ PIN BAR + LIQUIDITY AREA (SUPPLY) – Key zones to watch
✅ RESISTANCE = SAFE ENTRY – Wait for confirmation, not impulse
✅ RISKY ENTRY (ENTRY 1) – Only for aggressive traders
✅ SAFE ENTRY – After STOP HUNT & liquidity sweep
✅ TARGET AREA – Clear profit zone once manipulation is cleared
📌 Smart money hunts stops – don’t be the prey. Be the trap.
🚨WHEN DID THE TREND CHANGE?👀👇
✅ Uptrend = Higher Highs & Higher Lows
✅ Downtrend = Lower Highs & Lower Lows
✅ The shift happens when price STOPS making HH/HL and starts making LH/LL
✅ In this example, the change occurred when price broke the previous lows
✍️Watch for broken structure – that’s your clue.
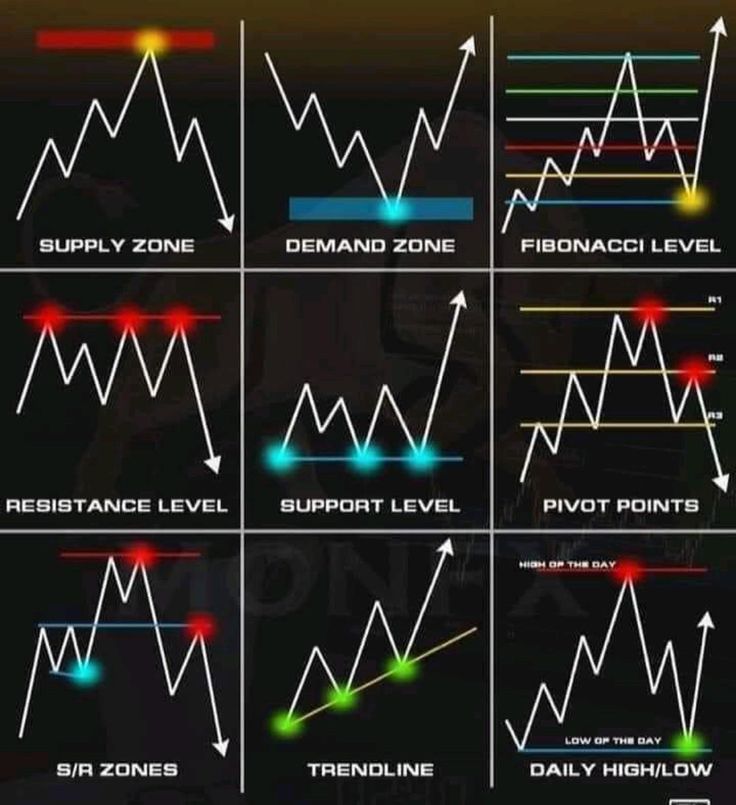
ORDER BLOCK vs SUPPLY & DEMAND
Order Block (OB)
✅ Institutional Zone
✅ Market Structure
✅ Liquidity Fill
✅ Precision Entry
Supply & Demand
✅ Supply Zone
✅ Demand Zone
✅ Strong Reaction
✅ High Probability
MOMENTUM INDICATORS ✍️
✔ MACD
Buy when MACD crosses above Signal Line; exit when it crosses below.
✔ RSI
Buy above 30; take profit when it drops below 70.
✔ STOCHASTIC
Buy when %K crosses above %D under 20; exit when %K crosses below %D over 80.
✔ CCI
Buy when CCI breaks above +100; exit when it falls back below +100.
One thing nobody tells you about crypto:
The hardest part isn’t losing money.
It’s watching a coin you sold go another 5x.
I’ve made good trades, taken profits, followed my plan, and still spent days thinking about the money I “could have made.”
Eventually I realized something.
The traders who last the longest don’t try to catch every dollar.
They take their piece, move on, and look for the next opportunity.
Because there will always be another chart.
There will always be another narrative.
But if you keep looking backwards, you’ll miss the next one.