$PYTH Macro chart
$PYTH is facing Resistance here and I wouldn't be surprised to see a pullback to $0.04-0.05 before breaking out of this giant Downward Channel 📈
🔨 Major Resistance/Target 1 - $0.12-0.18
🎯 My main targets are $0.5 - $1 - $1.8
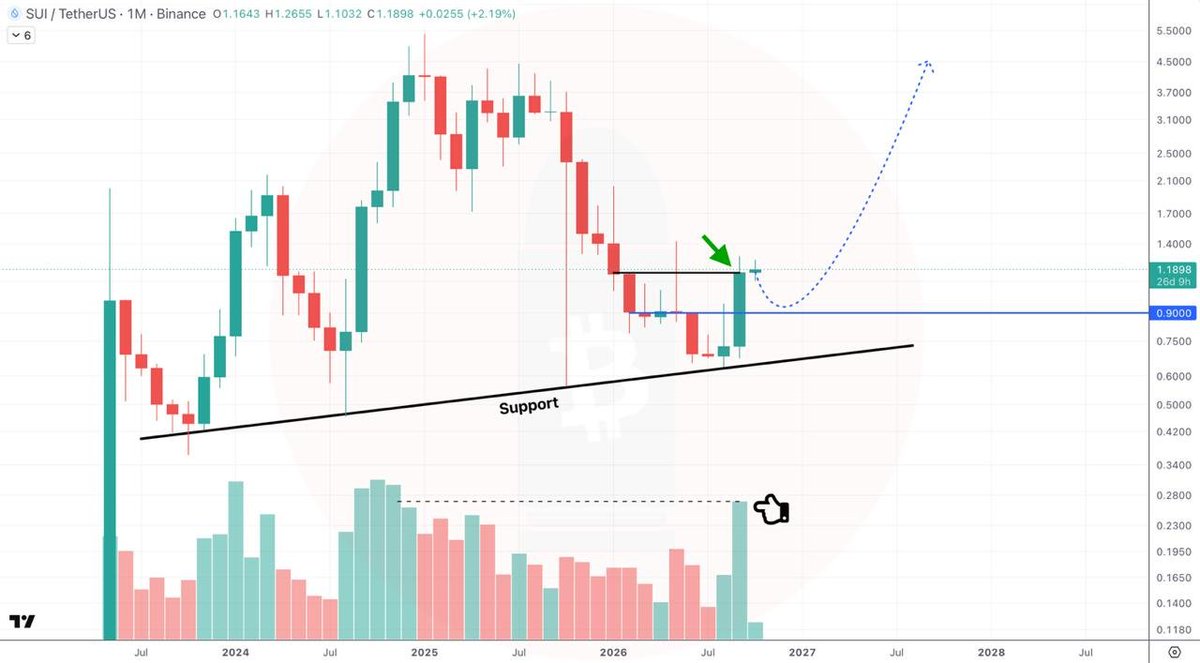
$SUI 1M chart
👉 Highest Monthly Close since December 2025!
👉 Highest Monthly Volume since November 2024!
$SUI looks so strong
A dip to $0.9-1 would be welcome (not guaranteed, but if it happens, don't hesitate to pull the trigger)
A new ATH is coming anyway 📈 😌
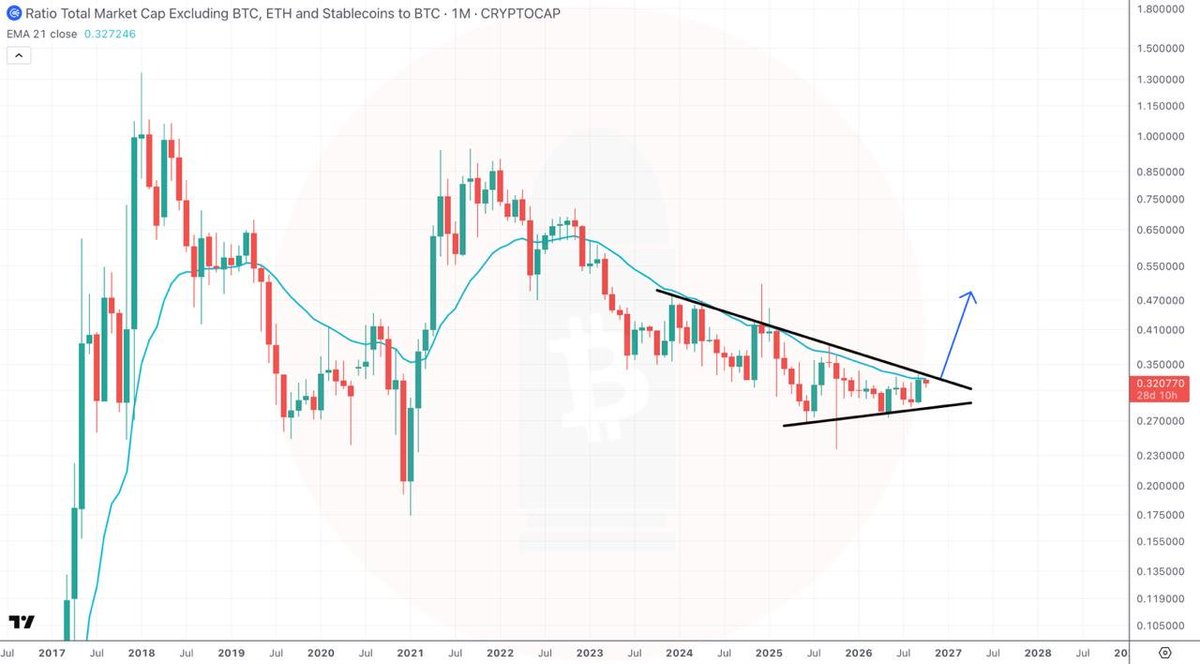
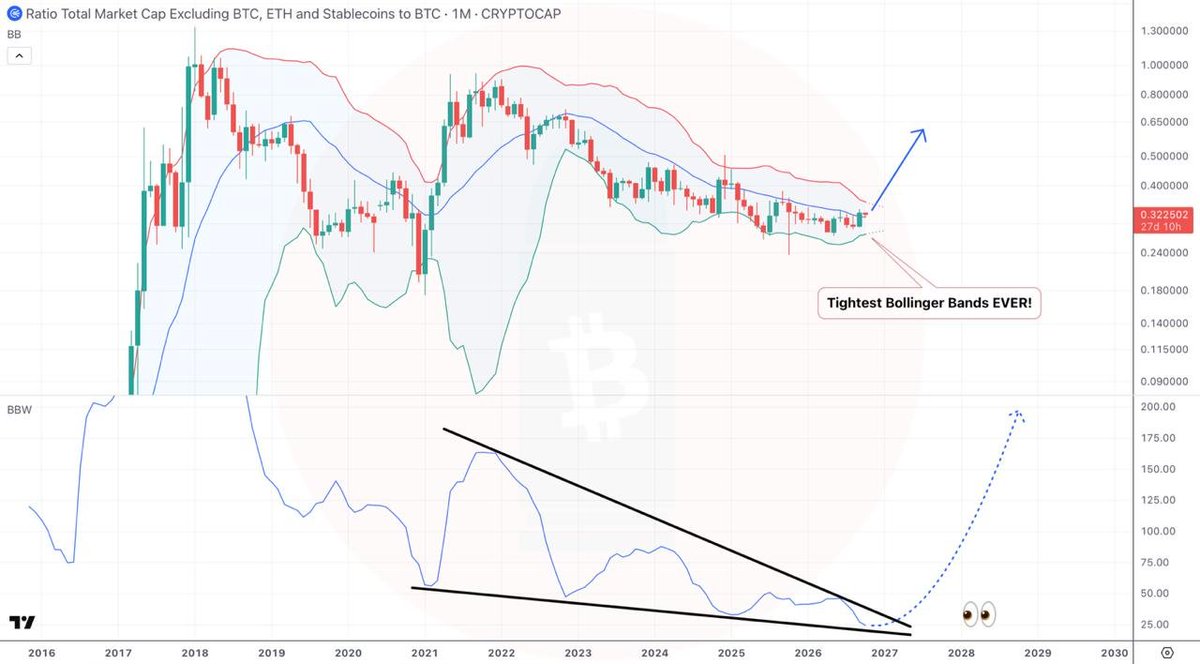
$OTHERSBTC printed the Highest Monthly Close since January 2025! 👀
This is starting to look like an Ascending Triangle and we're very close to a breakout 📈
#Alts 🔥⌛️😌
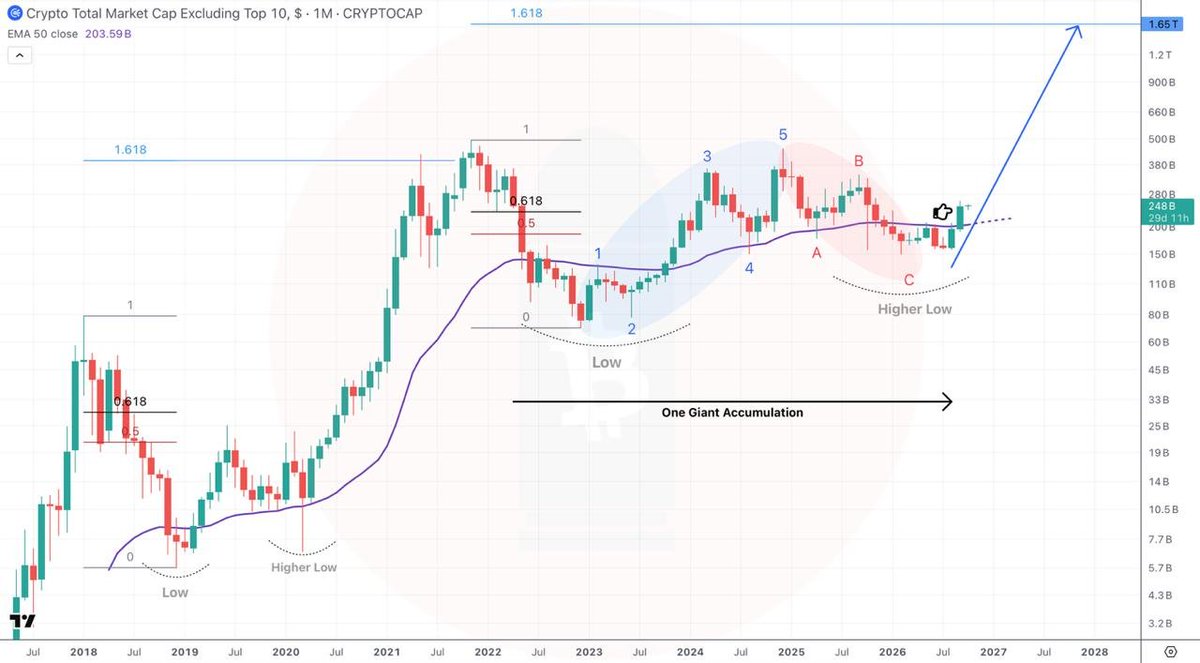
$OTHERS Macro update
Well, that was it guys.
As expected, in 2026 we broke below the EMA50 but we only reached $150B (I thought we would go to $110-140B 🤷♂️)
Now we’re back above the EMA50. A Higher Low was established in Feb-July, Wave C completed ✅
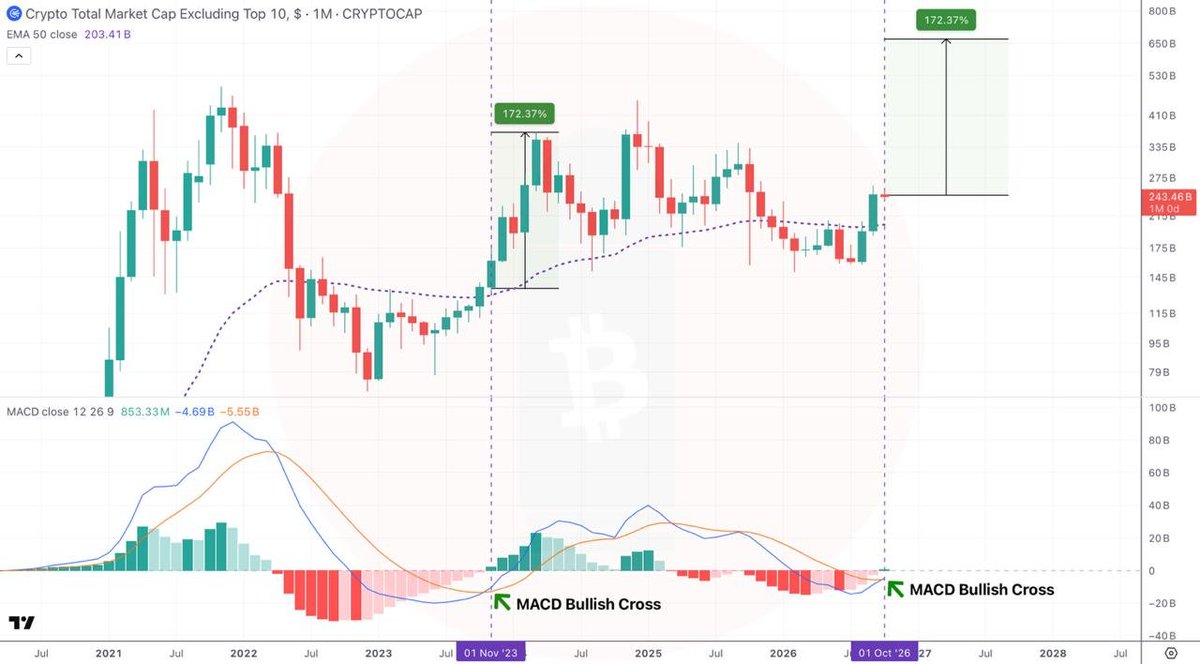
$OTHERS 1M update
In August we printed a bullish reversal.
$OTHERS broke above the EMA50 and closed the monthly candle above the Resistance line 💪
We could see a retest $230B and then more upside 📈
I doubt we’ll break back below the EMA50 anytime soon
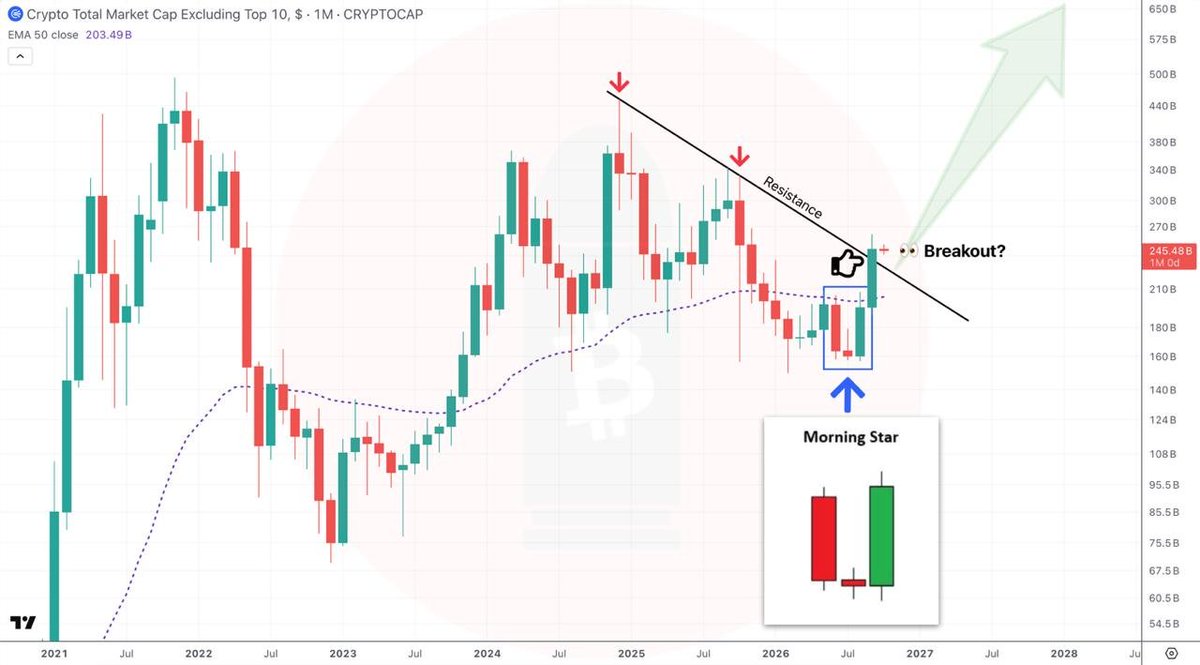
$OTHERS 1M chart
Printed a textbook Morning Star reversal pattern 👀
Still facing the EMA50 resistance though, but the way everything is shaping up September could be pretty bullish for #Alts
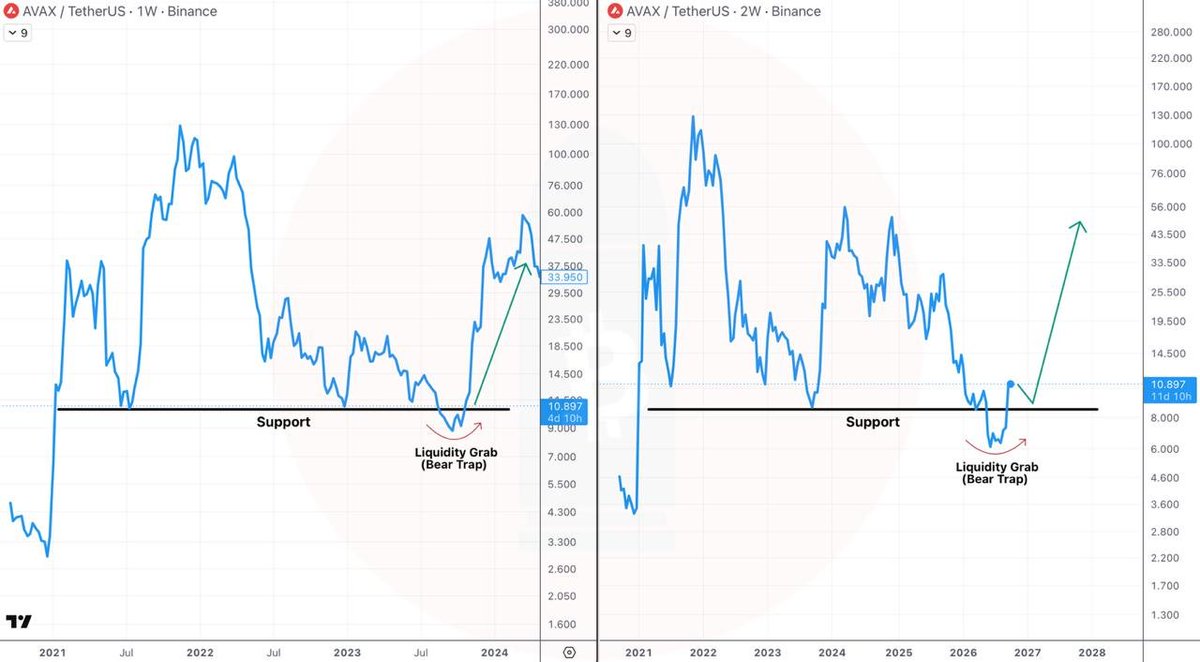
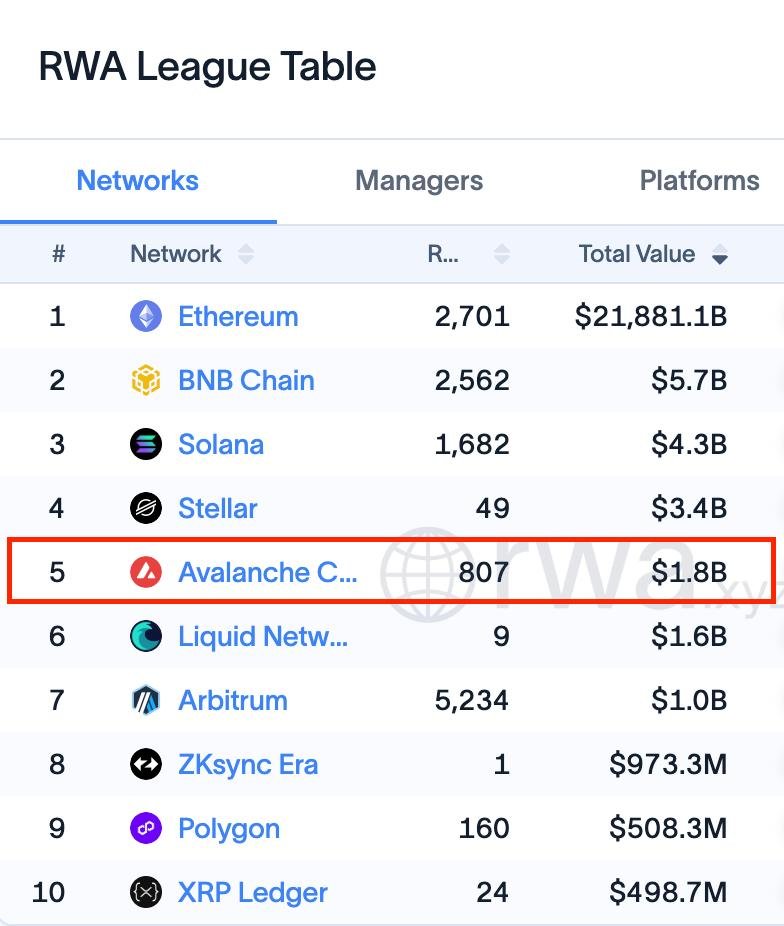
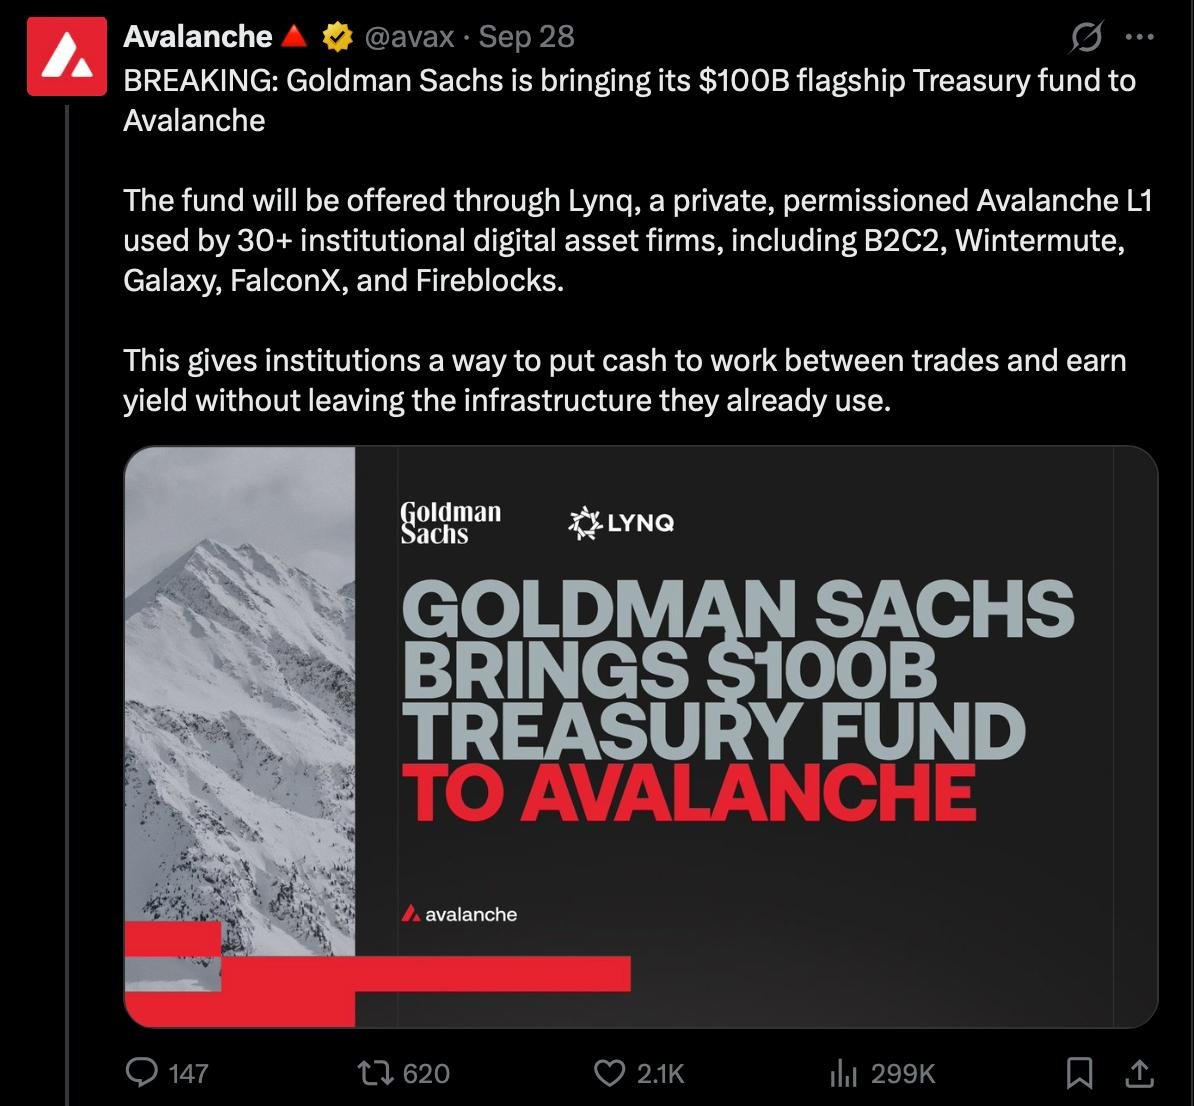
The Bear Trap that $AVAX printed in Summer 2026 is almost identical to the Bear Trap printed in August-October 2023 👀
I’m very bullish on $AVAX for 2027-2028 📈