Watch out for this 🚨
BTC Daily Chart Analysis:
Today we're sharing a projection different from what's being discussed across all media — this is just one possible scenario that many investors aren't seeing. It's not absolute, nor 100% certain to happen. It's simply another way to look at it 👍🏻
Everyone is talking about the famous 90,000 – 92,000 levels (and they're not wrong) because it's the next target on the Weekly Chart. But when something is this obvious, this logical, and this widely discussed, we should always ask ourselves: why is it? Is it the perfect opportunity — or is there a trap waiting there? 🤷🏻♂️
With that said, yesterday $BTC offered a LONG opportunity that rarely presents itself, fulfilling the following confluences: Daily #FVG + Pivots + Previous Range Support + Liquidity + 50-period EMA 🔥
That last confluence is likely what most traders are already watching, since in this case the EMA acts as dynamic support for the entire rally — and yesterday price touched it for the first time since August 19th, when the rally began 👈🏻
Think of it this way: 100% of traders are watching the retest of the EMA, and it looks like a golden opportunity, right? 🤑
What we're saying is not that you shouldn't trade that LONG — we did trade it and grabbed the dip. However, thinking beyond the crowd is what makes the real difference in trading 💪🏻
Price may perfectly respect that zone (after all, it checks every confluence within our strategy). But what happens when everyone enters LONG at the same level? Isn't that the perfect opportunity to wipe them all out? 🩸
The thesis is simple: if everyone pushes it up and the market decides to flush it down, a drop to 75,000 – 76,000 would be the max pain for bulls ☠️
$BTC still has resistances above (82,500 – 83,000 as the first and 84,000 – 85,000 as the second). We can't ignore the obvious — if $BTC breaks above 86,000, the Weekly Target could absolutely play out.
#Bitcoin #Crypto #Altcoins
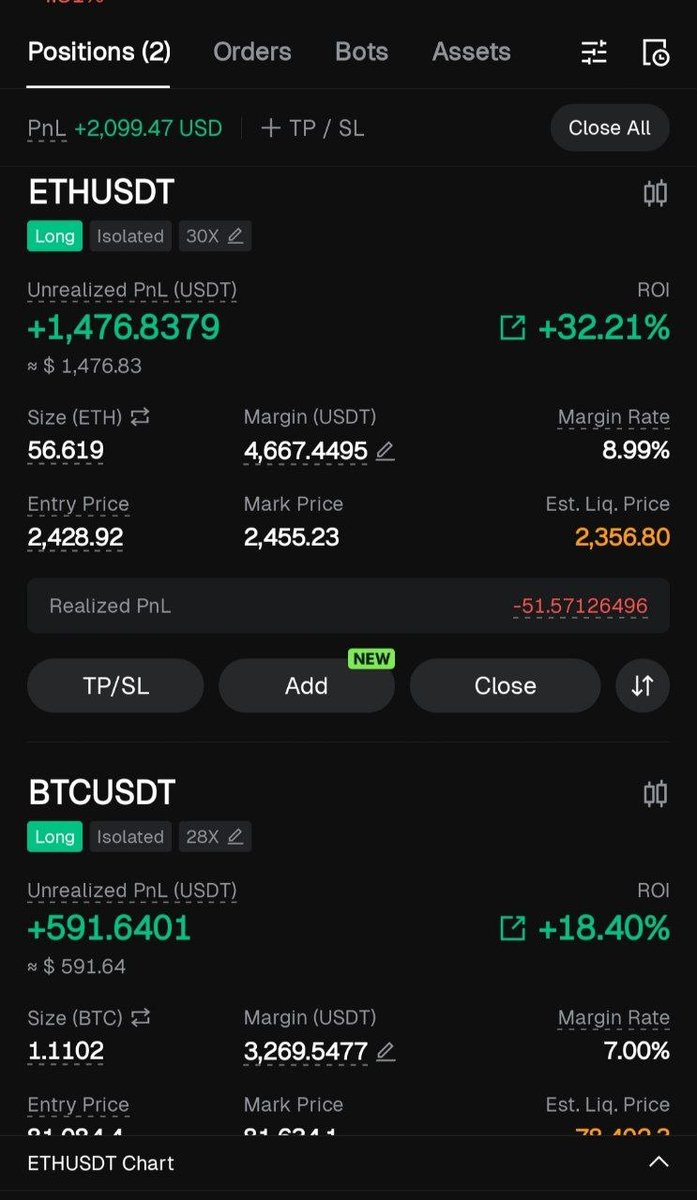
I'm sharing a bit of my joy from some Shorts I've been holding for a couple of weeks on my personal BingX account 🔥🔥🔽
Thanks #BTC and #ETH for fulfilling our analysis very well, which we've had since even before my trip 🫶🏻
#CryptoTrading#BingX#Profit
BTC respected the last support — is a rally incoming? 🚨
Bitcoin 4H Chart Analysis:
#Bitcoin has been correcting since it tapped the Annual Open Price (near $87,000). Today, for the first time in minutes, it lost the most critical support of the macro bullish structure ($80,000) — the lower pink line 😱
It touched $79,750 and reacted with an engulfing candle, bouncing strongly. This was the last zone we flagged for a LONG attempt (risky, but with solid confluences) 🔥
Anyone who entered that zone (between $79,750 and $80,400) should already be protected with stop-losses and taking partial profits at rejection zones 💵
How high could $BTC go?
Short-term, the $82,500–$83,000 range will act as resistance (previous pivot levels). The major resistance sits between $84,000 and $85,000 👈🏻
Many traders are now eyeing the Weekly Target ($90,000–$92,000) — a zone we haven't ruled out — but $BTC will face both of these key areas first. Don't get ahead of the wave 🌊
If Bitcoin clears the first resistance and pushes toward the second, we know exactly where to look for the setup:
1️⃣ Last SHORT Zone ($84,500–$85,000): Daily #FVG + 4H #FVG + 0.618 Fibo + Resistance
A SHORT can be attempted from $84,000 (entry alert), but this zone also lines up with accumulated SHORT liquidity. In simple terms: if it already liquidated below, it could do the same above. The price difference is minimal and manageable from $84,000 👍🏻
Liquidity map for 100x, 50x, and 25x leverage included below for reference 💰
⚠️ Key level to watch: If $BTC breaks above $86,000 (upper pink line), holding a SHORT becomes dangerous.
#Bitcoin #Crypto #CryptoTrading
Inflation rises and the market falls 🚨
BTC analysis — 1H + 4H chart:
Bitcoin woke up today with red candles after the CPI data came in higher than expected. This triggered short-term selling pressure, but the bias has been SHORT ever since $BTC tapped its Golden Pocket near $84,300 🔥
Will we keep dropping? Most likely yes — and we'll say it again: as long as $Bitcoin fails to break the 0.618 Fib level and the 4H #FVG zone ($84,500 – $85,000), the arrow points down 🩸
Short-term priority is SHORT. And considering the small consolidation $BTC printed yesterday between $83,000 and $84,000, that range's lower boundary will now act as Resistance 👈🏻
With that said, here's the ideal entry zone to position yourself in the bearish move:
1️⃣ SHORT Zone — 1H ($82,750 – $83,000)
It's unlikely $BTC breaks through that zone and pushes back to the upper part of the range ($84,000) — but if that scenario plays out, you already know: as long as $BTC doesn't clear the confluences mentioned at the start of this analysis, shorting remains valid 👍🏻
Sharing the $50x and $100x liquidation map for reference 🗺️
BTC's Last Resistance 🚨
BTC 4H Chart Analysis:
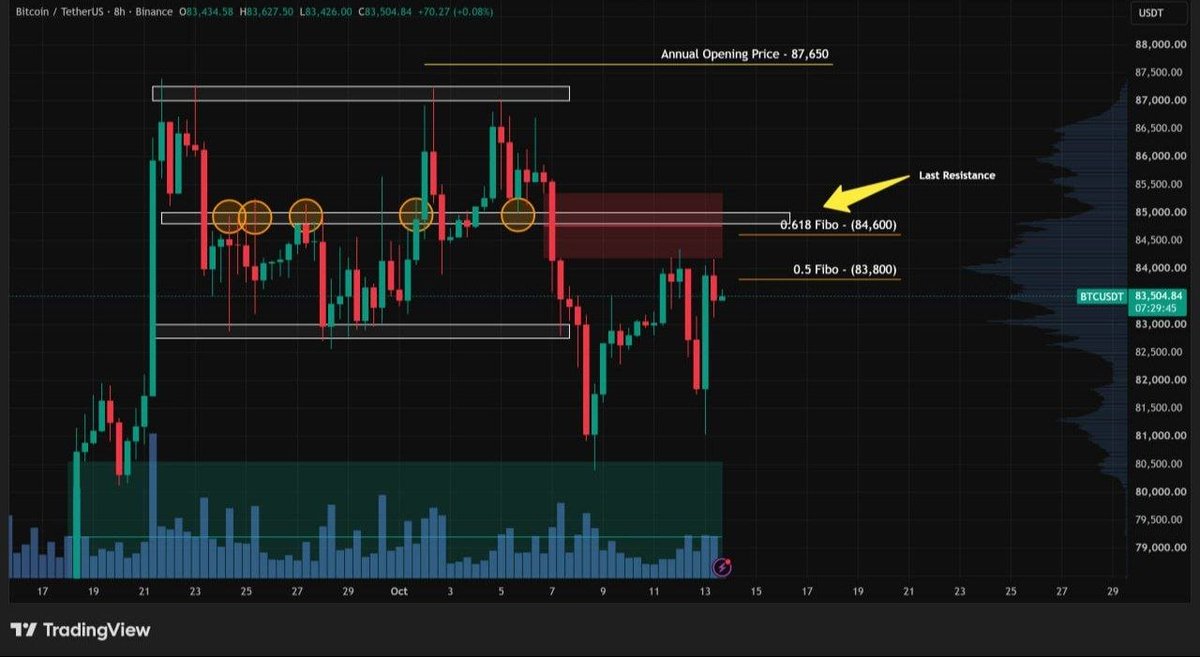
Bitcoin rejected from our entry zone near $84,000 (which met all our confluences), dropping hard with heavy outflow Money Flow (around 4%). It looked like it was going to break the lows — but then showed unusual behavior, recovering in a single 4H candle everything it had retraced 🤷🏻♂️
Don't forget that tomorrow we have the CPI data, which is likely why price is this volatile. However, one thing is clear: as long as $BTC can't break above $86,000, the direction is down 🩸
What determines that drop? The 4H #FVG and the 0.618 Fibo (Last Resistance) 👈🏻
If price starts closing candles above both confluences, attempting SHORT becomes very dangerous — and the Weekly chart target ($90,000 – $92,000) would open up. Although the probability of that scenario has decreased, it hasn't been ruled out ❌
Staying true to the strategy, here's how to play it:
1️⃣ Last SHORT Zone ($84,500 – $85,000):Daily FVG + 4H FVG + 0.618 Fibo + Resistance
In moments of indecision like this, patience is key — wait for the zones with the highest probability of success, always protected by your SL ⚠️
#CryptoTrading #Blockchain #DeFi
📢 Most relevant macro events of the week (Oct 12 – Oct 16, 2026)
1️⃣ Wednesday, October 14 – CPI Data Release
The previous reading was 3.4% and the market expects 3.6%.
a) If it comes in at 3.5% or below → neutral/bullish for markets
b) If it comes in at 3.6% → neutral/bearish for markets
c) If it comes in at 3.7% or higher → very bearish for markets
2️⃣ Thursday, October 15 – Unemployment Claims
The number of individuals filing for unemployment insurance for the first time last week — a key indicator of how well or poorly the US economy is performing. Expectation: 195k.
Additionally, Kevin Warsh will deliver a conference on the forces transforming the global economy at the Annual Meetings of the IMF and the World Bank Group, in Bangkok.
⚠️ The most market-moving event this week is the Inflation rate — expect potential volatility on Wednesday. $BTC $ETH and the broader crypto market could react sharply depending on the print.
(Recommended: pair this post with an image showing rising consumer prices to boost engagement.)
⚠️ Dangerous for $BTC to lose this zone 🚨
BTC Analysis — 1H + 4H Chart:
#Bitcoin had its expected bounce and rejected right at the previously mentioned zone — the 4H Golden Pocket (between $84,000 and $85,000) — where we had a confluence cluster to attempt a SHORT entry 🔥
Will we lose $80,000? As mentioned in previous analyses, that price level is critical for maintaining BTC's bullish structure. Losing it could trigger more aggressive drops (Weekly correction) 🩸
For now, since $BTC touched $80,400 and bounced up to $84,300, a bullish phase formed on the 1H chart and is now pulling back healthily toward the Fibonacci zone ($81,900 – $82,400) 👈🏻
Can a LONG be attempted there? A small scalp isn't out of the question — but more than trading it (since we entered from lower levels), it's our reference point to determine whether the bounce wants to continue or if we'll drop further ⏳
If $BTC doesn't hold that zone, how far could we fall? 🤔
The next target would be back to the start of the phase ($80,400) — but there's a high probability of breaking that level and dropping further ☠️
There's one last zone (high risk) where another LONG entry could be considered. We'll call it the "Uncomfortable LONG Zone" — between $79,250 and $79,750 (this would be the max pain for the Bulls) 🤷🏻♂️
We'll see if #Bitcoin can hold its structure or if it finally breaks down 🔚
#Crypto #TradingView #DeFi
ETH on a tightrope 🚨
ETH Daily Chart Analysis:
Yesterday, a major move shook the Crypto market. After several consecutive rallies, many traders positioned in LONG were liquidated ☠️
One of the most affected coins was $ETH, which broke its range ($2,650 – $2,740) to the downside with strong momentum, dropping more than 10% in just 2 days 🩸
Have we reached a temporary top in $ETH for a stronger correction? 🤔
It's a fact that the rally we've seen from July to date has been overextended — it's been a long time since we saw the CryptoMarket this strong. But you already know the law of gravity: what goes up must come down ⏳
At this point, $ETH is sitting on a key Pivot Support just above $2,400. It's critical that this level holds if we want to see a continued bounce — otherwise, it could trigger far more aggressive drops and push us toward levels near $2,100 ⚠️
For now, the most important resistance sits within the #FVG (Fair Value Gap) generated during the sell-off of the last 48 hours. If $ETH fails to reclaim it, expect a strong rejection and the beginning of a more aggressive downtrend 🤷🏻♂️
On the other hand, if it manages to break above and re-enter the previous range, $ETH could launch another bullish move 🚀
Does it break down or break up — what do you think? 👀
#Bitcoin #TechnicalAnalysis #DeFi
BTC has finally liquidated! 🔥
BTC 4H Chart Analysis (Follow-up):
#Bitcoin finally breaks the range to the downside and this time it was all about liquidity — it dropped almost non-stop down to $80,500 🩸
In previous analyses, we've noted that the $80,000 support (which aligns with the Pivot Points of the prior larger range) is critical to maintaining $BTC's bullish structure ⚠️
So, are we heading to $90,000 – $92,000 from here? I know many of you are asking this, and while we can't rule it out 100%, we need to stay focused on Price Action and break through several key Resistances above before targeting that level 🤷🏻♂️
For now, set that target aside and let's focus on the Resistances 👈🏻
1️⃣ First Resistance ($82,750 – $83,000): Aligns with the bottom of the prior range + Breaker Block
2️⃣ Second Resistance ($84,000 – $85,000): Golden Pocket + POC + FVG + EMA
If we manage to reclaim $85,000 and recover $86,000, then we can look at the Weekly Target — but we can't ignore that this drop came with volume (negative Money Flow) and Spot selling pressure ☠️
On the other hand, the oversold conditions on this timeframe could trigger a bounce. Let's see if $BTC can reach the first and second Resistance levels (targets to take profits on LONGs or attempt a SHORT) ⏳
We've been talking about the Weekly Chart correction for weeks now. If $BTC doesn't bounce from here, fails to reach even the first Resistance, and loses $80,000 — that would confirm we won't be seeing $90,000 – $92,000 anytime soon, and the drop could go much deeper. Stay alert 🚨
@aqeel68007 Ideally it shouldn't lose the 3,960 support (it should even respect 4,000), but if it does, I would close at a loss.
I would reopen a new one between 3,850 and 3,900 since liquidity would have been taken from LONGs and we have a Weekly FVG that will act as strong support.
GOLD Could Bounce in This Zone 🚨
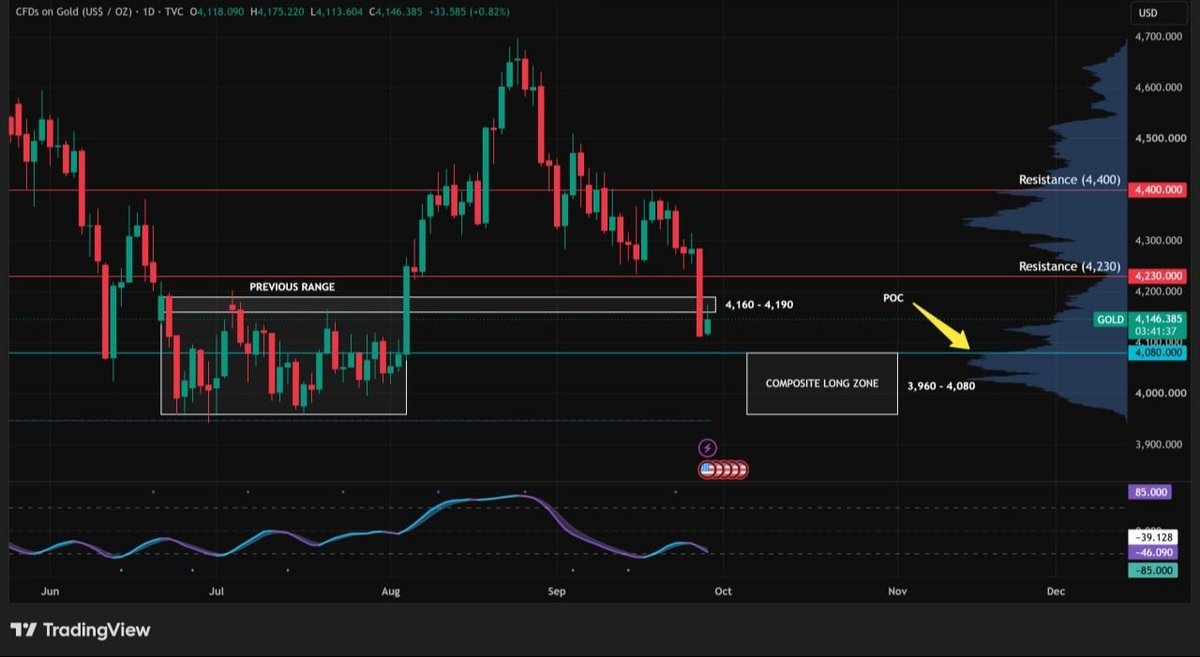
GOLD Analysis — Daily Chart:
Today we're analyzing the safe-haven asset while we wait for the previously mentioned $BTC zone to go LONG 🚀
From the formation of the Previous Range (3,960 – 4,190), $GOLD managed to rally over 12% toward the 4,700 level 🔥
As with any rally, we were patient waiting for a healthy pullback — and following our strategy, we knew the upper boundary of the Previous Range (4,160 – 4,190) was the best zone to look for that launch 👍🏻
However, $GOLD pulled back a bit deeper, largely driven by capital rotation into #TreasuryBonds (this happens when investors seek higher yields in more "stable" assets). A few days ago, the #FED also hiked interest rates, which further influenced bond yields 🤷🏻♂️
On the technical side, $GOLD appears to be slightly slowing its decline and seeking support for a bounce. Keep in mind it's a slow-moving asset for those looking to trade it ⏳
Could it fall further? Yes, there's a possibility of a deeper retracement. Stay prepared for 2 scenarios:
1️⃣ If it consolidates at current price (between 4,110 and 4,150), it could bounce toward 4,230 as Target 1 and 4,400 as Target 2
2️⃣ If it reaches the POC (blue line below 4,080), that's a second opportunity to enter LONG — in fact, the entire zone between 3,960 and 4,080 would be ideal for that setup (Composite Long Zone), with the same Targets (4,230 and 4,400 respectively)
The oversold condition on $GOLD across the Daily and lower timeframes has extended significantly — a reaction should be expected if price reaches that second zone 💪🏻
#CryptoTrading #TradingAnalysis #GoldTrading
Watch the liquidity 🚨
BTC Analysis — 4H Chart (Follow-up):
Bitcoin dropped aggressively in the last 24 hours, falling almost uninterrupted from $86,700 down to the bottom of the range ($82,800) 🤷🏻♂️
In yesterday's analysis, we noted that on 2 previous occasions the price had chosen not to sweep liquidity, bouncing from the bottom and breaking the top with strength — continuing the bullish move 🚀
Today $BTC reached the bottom of the range, but it did so very fast and with negative Money Flow, which increased the risk of going LONG at that level ⚠️
So — was entering LONG between $82,750 and $83,250 a mistake? Not at all. You're trading the bottom of the range, but remember: Price Action is king 👈🏻
If you're already in from the bottom (avg. ~$83,000), you have the Smart Trend in your favor, the oscillator approaching oversold, and range support on your side.
Your job now is to manage the trade in case price revisits, and wait for the best zone to go LONG if it breaks down:
1️⃣ Best LONG zone ($81,000 – $82,000): Support + Pivots + Liquidity + 0.5 Fibo
The liquidity sitting there is massive — will it get swept this time? 🤔
We're clearly approaching strong LONG zones. The opportunity is there — ideally, the best entry comes once that liquidity gets taken 🔚
Liquidity map shared below for reference 💰
#Bitcoin #Crypto #Trading
📢 Most relevant macro events of the week (Oct 5 – Oct 9, 2026)
1️⃣ Wednesday, Oct 7 — FED Minutes
The FOMC will release the detailed record of its most recent meeting, offering key insights into the economic and financial conditions that shaped their decision on Interest Rates. A must-watch for anyone positioned in crypto or traditional markets.
2️⃣ Thursday, Oct 8 — Unemployment Claims
The number of individuals filing for unemployment insurance for the first time last week — a direct pulse check on the USD economy. Consensus estimate: 200K. A beat or miss here could move risk assets.
⚠️ This week is relatively light on data. The FED Minutes are the main event — any hawkish or dovish tone shift could trigger volatility across #BTC, #ETH, and broader altcoin markets.
#MacroMonday #CryptoTrading
BTC is About to Make a Strong Move 🚨
BTC 4H Chart Analysis (Follow-up):
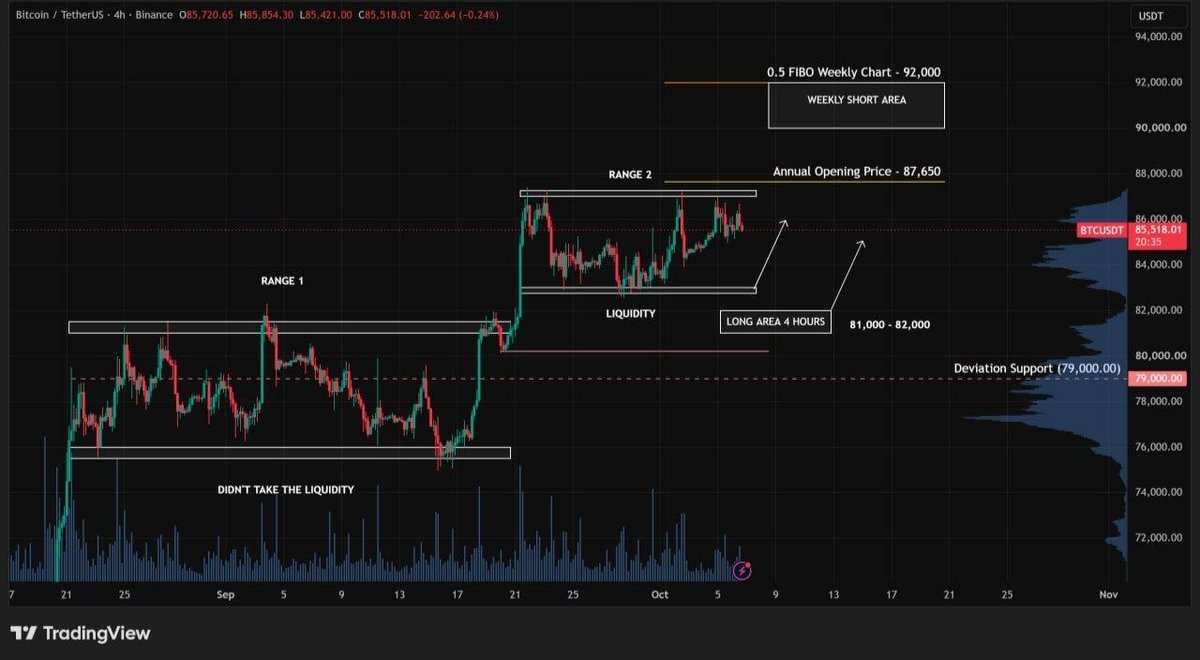
Market behavior remains the same — sideways. The $87,000 resistance is clearly strong, almost as if someone is forcing #Bitcoin to pull back every time it gets close 🤷🏻♂️
In other words, $BTC is compressing... right before the next big move 💪🏻
Long or Short — which do we prioritize? 🤔
The market is overheated. We've been climbing practically from $63,000 with no real corrections. Add to that a Fear & Greed Index sitting at 73 points — and yet, we can't ignore the Weekly Target still in play near $92,000 (0.5 Fibo) 🔚
Following $BTC's structure, there are only 2 zones to consider for a LONG:
1️⃣ First LONG zone ($82,750 – $83,250): Bottom of the range (Support)
2️⃣ Best LONG zone ($81,000 – $82,000): Support + Pivots + Liquidity + 0.5 Fibo
Entering LONG after stop losses are swept or liquidity is taken is always the safer approach — but as we saw in the previous range, liquidity was never grabbed and price broke upward directly 🚀
Will the same happen again, or will we grab liquidity first before bouncing? Since we can't know for sure, the play is to manage both scenarios — or simply wait for the Best Zone (personal decision) 👈🏻
⚠️ Key Level: $80,000 is the most critical price for $BTC right now. In case of a deviation, a quick wick to $79,000 (4H #FVG + Strong Daily #FVG) is possible — but price must recover immediately.
#Bitcoin #TechnicalAnalysis #CryptoTrading
Which way will BTC break? 🚨
$BTC 4H Chart Analysis:
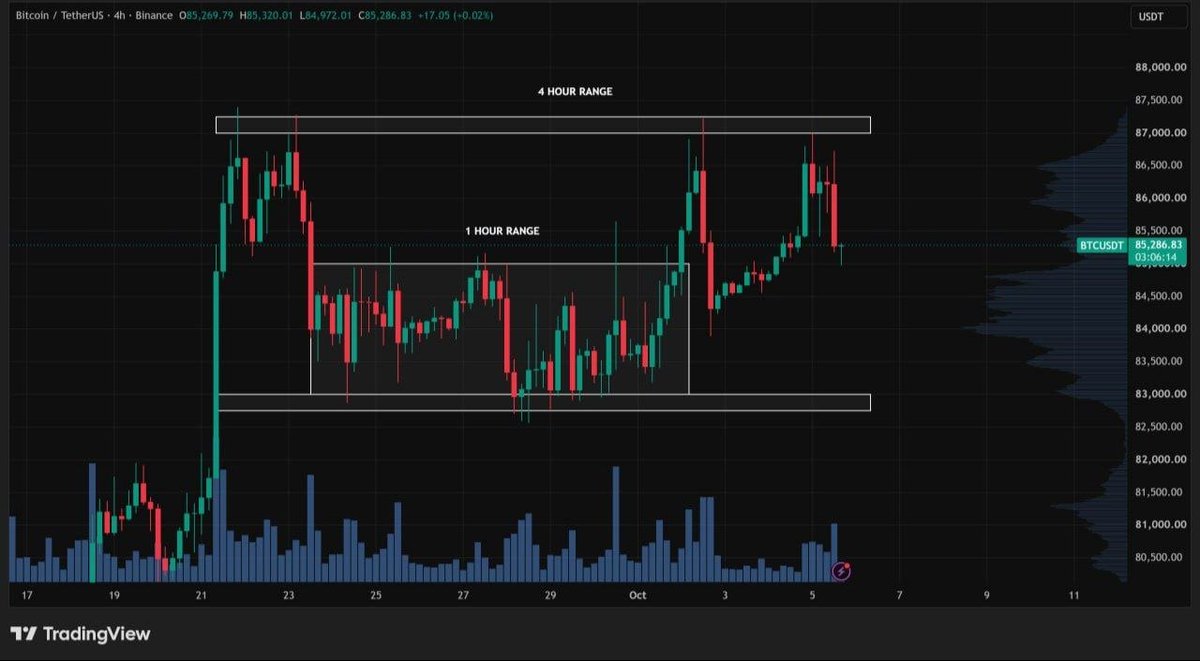
Bitcoin behavior over the past few months has been the formation of ranges that typically last between 20 and 30 days on average (some can extend longer). It seems we'll have to get used to these types of patterns in this new cycle 🤷🏻♂️
Updating the latest, we were trading a first 1H range for 8 days (between $83,000 and $85,000), but now it looks like we're in a larger 4H range that has lasted 14 days (between $82,750 and $87,250) 👈🏻
If we look back, from the range between $62,500 and $65,000 (where we spent 40 days), after consolidating we broke upward — then we were in another range between $75,000 and $81,000, and after consolidating, we broke upward again 🚀
Will the same pattern repeat with this new range we're in? 🤔
It's a possibility, and the longer we consolidate sideways (time correction), the more likely a breakout to the upside becomes 😱
Let's not forget the target we haven't discarded from the Weekly Chart — the 0.5 Fibo near $92,000 — so there's still a possibility of tapping that zone before the correction we've been talking about so much finally begins ⏳
The key takeaway from this analysis is identifying a range in advance so we can trade accordingly 👍🏻
#Bitcoin #CryptoTrading #TechnicalAnalysis
🚨 Market Pump & Dump
BTC 4H Chart Analysis:
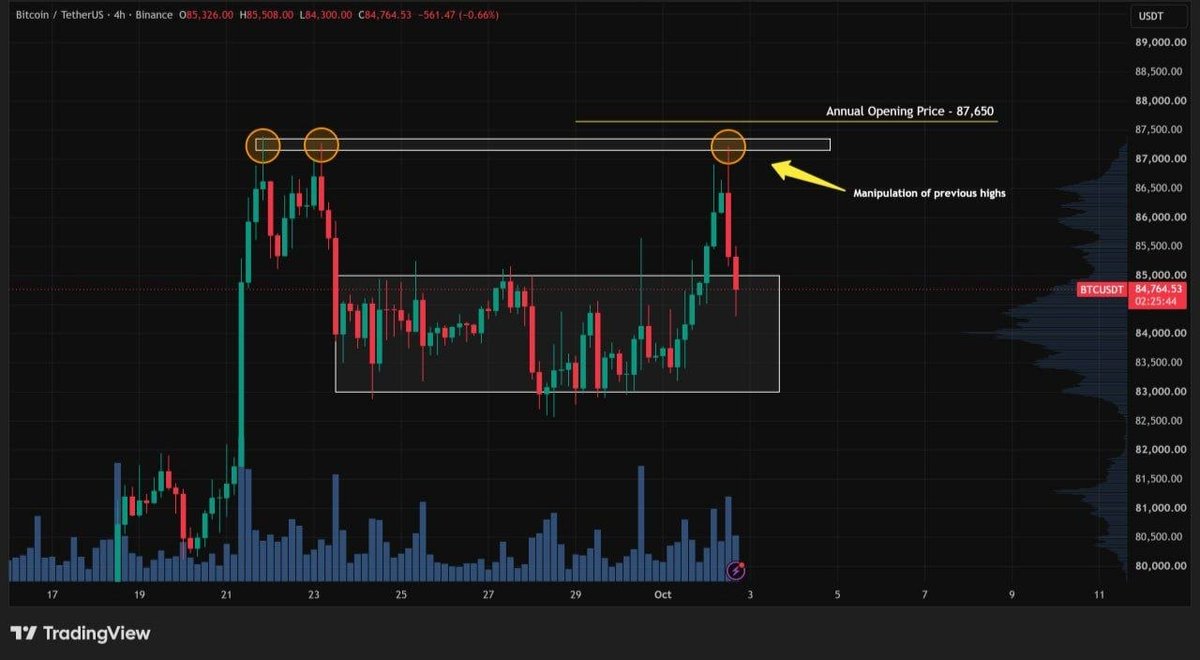
#Bitcoin finally breaks out of the range to the upside, surpassing $85,000 and reaching $87,000 — but something in the Price Action is a red flag: a bearish engulfing candle swallowed the two previous green candles with a liquidity wick. ❌
Many traders are looking to go LONG right now since price is back at $85,000 — the top of the previous range (former Resistance, now Support). 👀
Strictly speaking, that entry is dangerous. Price Action takes priority here, and it doesn't look good. A re-entry into the range is not only possible — it's already happening. 🤔
The move that took us out of the range was aggressive, but a return with equal force signals manipulation of prior highs to flush out SHORT positions (Pivots above $87,000), right near the Annual Open Price. 👈🏻
This drop left an FVG on the 1H chart near $86,000 (short-term Resistance) — a potential scalping zone to the downside for those looking to ride the bearish move. 🩸
Conclusion: Based purely on Price Action, the smart play is to wait for a bounce and re-enter SHORT. 🤷🏻♂️
#CryptoTrading #Blockchain #DeFi
🚨 Don't forget this zone
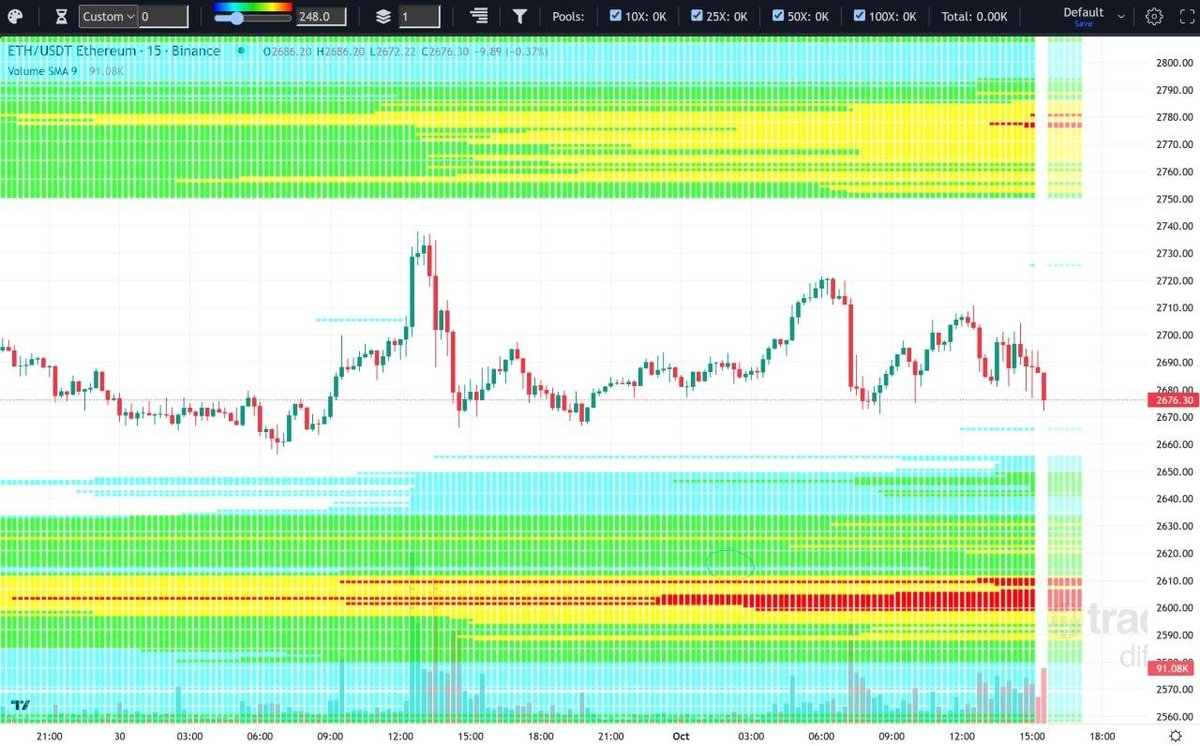
ETH Analysis — 1H + 4H chart:
BTC has been ranging for 8 days. The longer it stays in range, the more liquidity builds on both sides — and the stronger the breakout will be when it finally makes its move 🔥
Meanwhile, we're analyzing $ETH so that if #Bitcoin breaks downward (as we're projecting), we can execute a second trade alongside it 👈🏻
The recommendation is always to wait for $BTC to give entry confirmation before accompanying it with an altcoin (in this case $ETH):
1️⃣ LONG zone — 4H (2,570 – 2,600):
FVG 1H / 4H / Daily + Order Block + Pivots + Liquidity
The $2,550 support is critical — it must hold, as it coincides with the top of the previous 4H range (Pivots) and sits very close to the midpoint of the Daily FVG. In an extreme case, the drop could extend to that zone and still remain a valid LONG opportunity 🚀
Liquidity map for 10x and 25x leverage included for reference 💰
Always wait for $BTC to confirm direction first 👀
#ETH #Crypto #Trading
BTC Liquidated the Short Scalpers — Are the Longs Next? 🚨
BTC Analysis — 1H + 4H Chart:
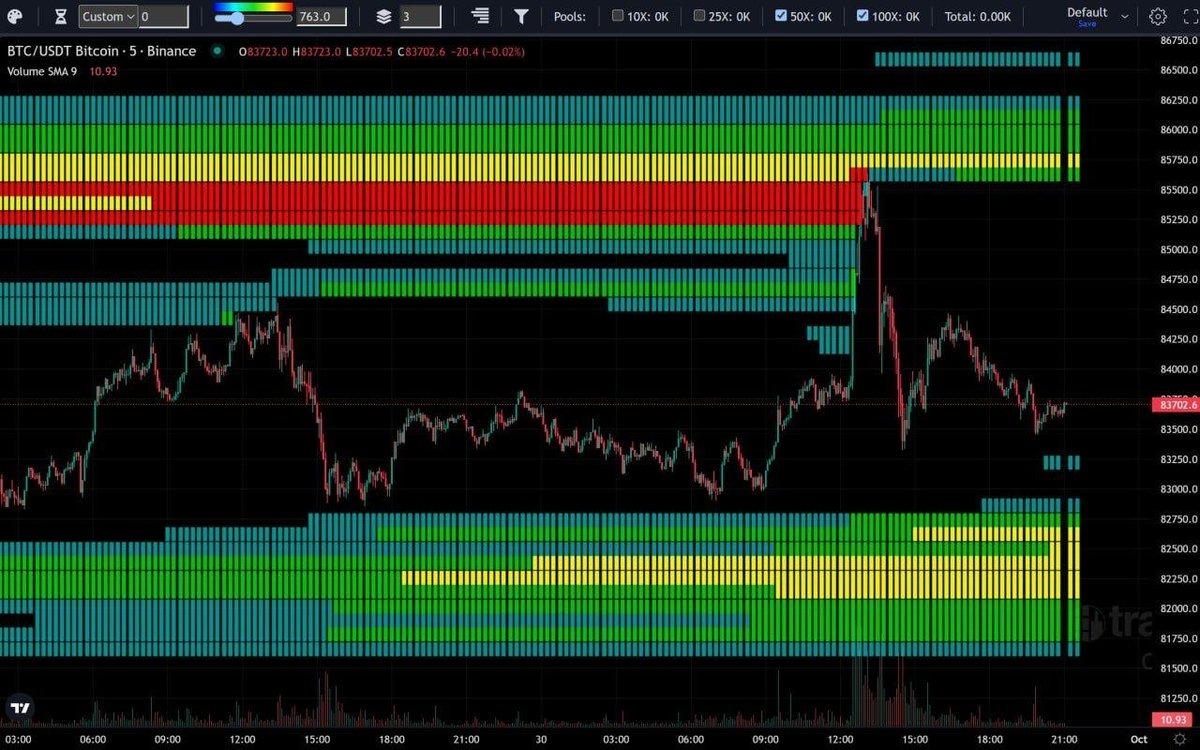
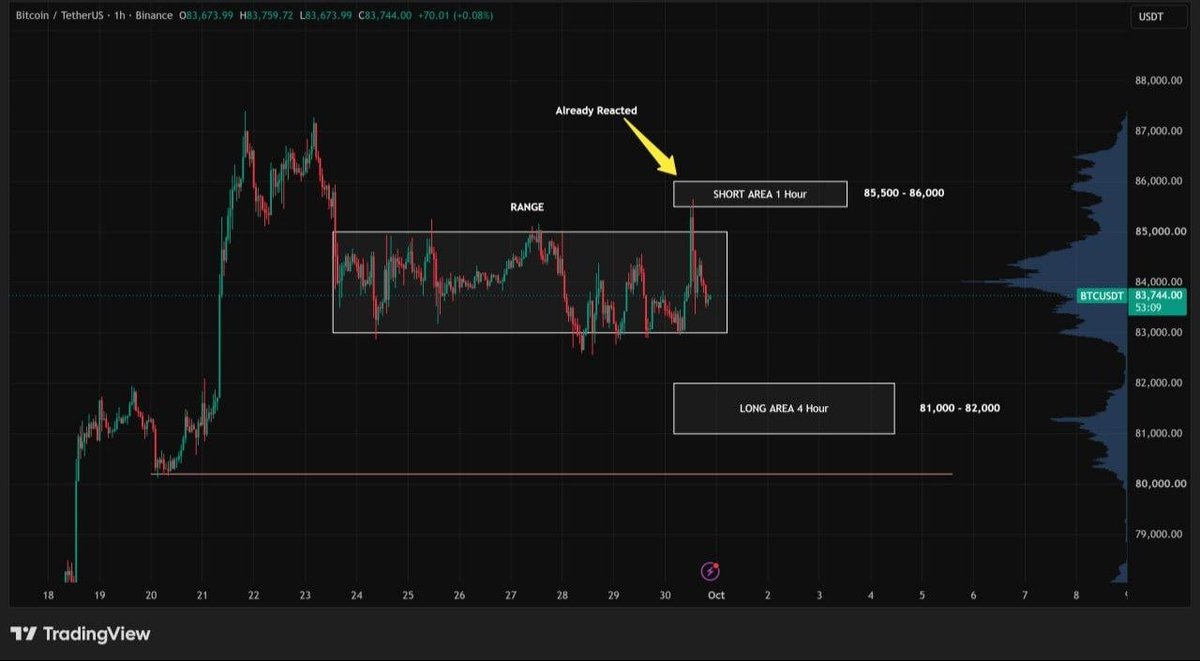
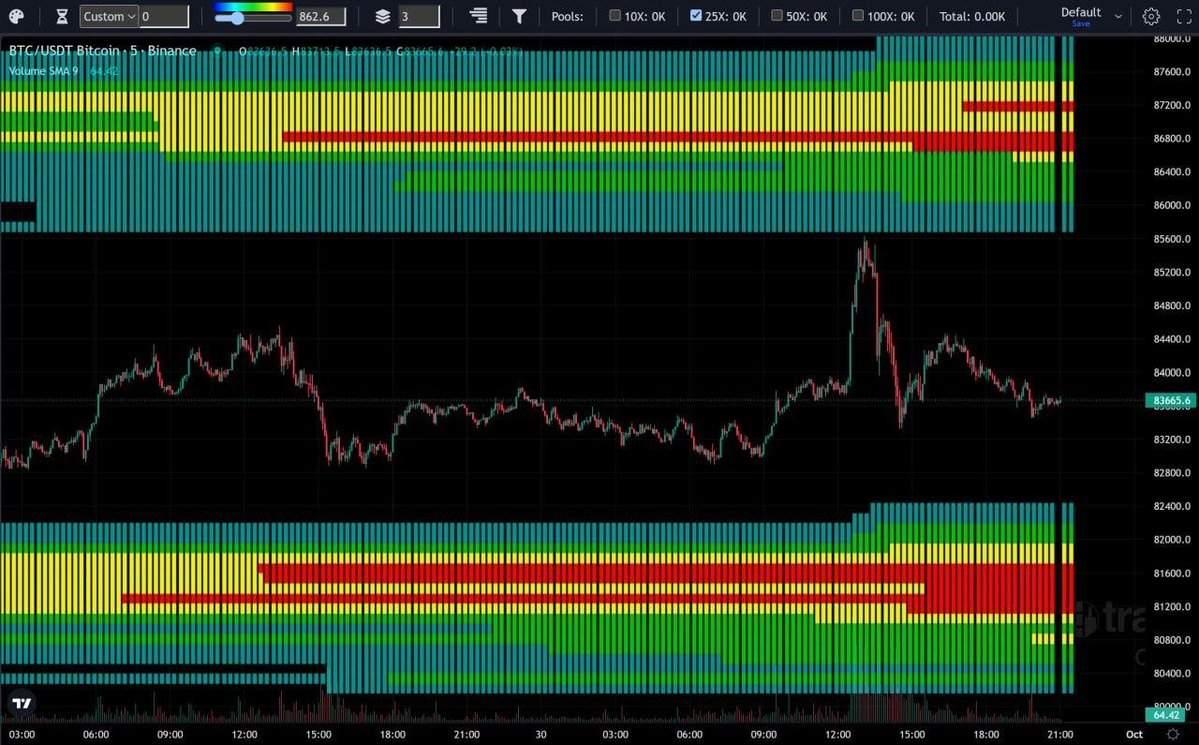
#Bitcoin made an aggressive move toward the upper end of the range today, reaching the $85,500 zone to liquidate short scalpers on the upside — then reacted perfectly, dropping back with the same aggression 🩸
Attaching the liquidity map to cross-check the closing of SHORT positions (50x and 100x) ❌
The absorption wick it left behind suggests it may now do the same thing on the downside 🤷🏻♂️
Revisiting the LONG zone once more:
1️⃣ LONG Zone ($81,000 – $82,000): Support + Pivots + Liquidity + 0.5 Fibo
Attaching the liquidity map to cross-check LONG liquidity (25x) 💰
Factor this into your trading strategy to aim for an ideal average entry below $81,500 — in case volatility extends further to the downside ⚠️
Key level to watch: $BTC must not close candles below $80,000 (pink line) 👈🏻
#Bitcoin #Crypto #TechnicalAnalysis
📢 Most relevant macro events of the week (Sep 28 – Oct 2, 2026)
1️⃣ Tuesday, Sep 29 — JOLTS Job Openings: number of job offers during the reported month, excluding the agricultural sector.
2️⃣ Wednesday, Sep 30 — Final GDP reading: annualized change in the inflation-adjusted value of all goods and services produced by the US economy.
3️⃣ Thursday, Oct 1 — Unemployment Claims: number of people filing for unemployment insurance for the first time last week (a key indicator of how well the USD economy is performing). Expectation: 199k.
Also: ISM Manufacturing PMI — survey-based index of purchasing managers in the manufacturing sector.
4️⃣ Friday, Oct 2 — UnemploymentRate: previous reading was 4.1%. Expected to remain unchanged at 4.1%.
#Crypto #MacroTrading #Bitcoin