Estas escenas apocalípticas son del sur del Líbano, son pueblos libaneses siendo borrados de la faz de la tierra, "Israel" están llenando de explosivos todas las aldeas y volándolas por los aires.
Esta barbarie está ocurriendo ante nuestros ojos, mientras la prensa lo silencia y la comunidad internacional lo permite.
People getting rich while the poor can’t eat
Old men making war from a distant seat
Truth gets buried under money, fear, and lies
And the innocent keep paying with their lives
Everybody talking, but nobody really heals
Posting broken hearts while the whole world bleeds for real
Smiles on screens, but the spirit looks tired
Walking through the fire while the planet gets darker
https://t.co/LsPl9DbCNr
#BTC
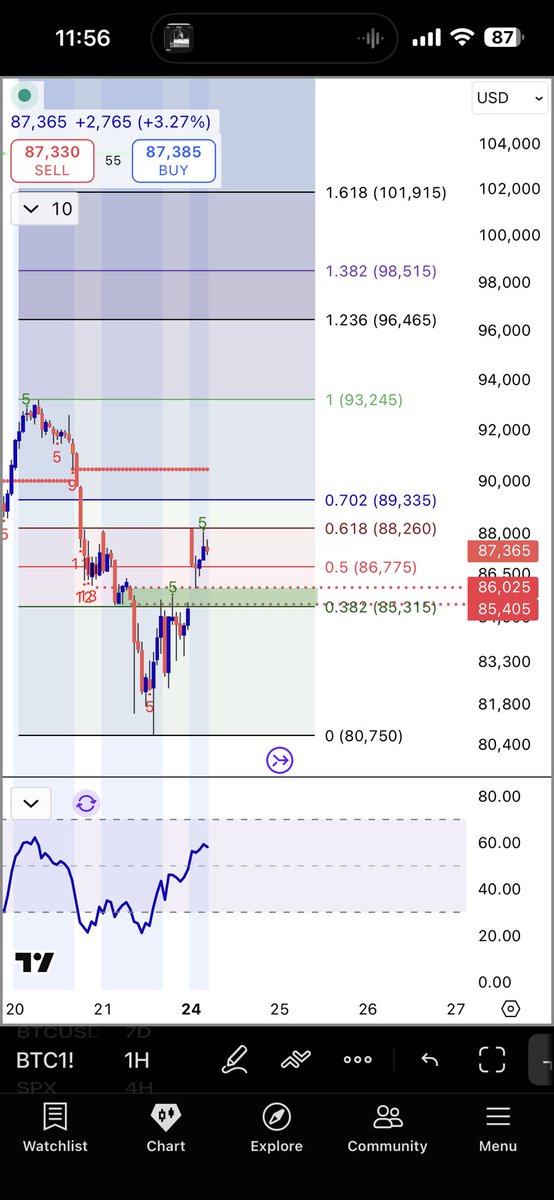
We still have an open CME gap around ~85.2K, which lines up nicely with the local 0.382–0.5 retrace zone.
Price has pumped from Sunday into early EU Monday, and very often the US session fades that bounce, pushing price back down into unfilled liquidity zones – in this case, the 86–85K region and that CME gap.
Given everything we’ve just mapped:
•Current context
•We’re bouncing off 80.7K low.
•Sitting under 88–89K Fib + EMA cluster + liquidity.
•CME gap waiting down at ~85.2K.
•If US wants to fade the bounce
•Price rejects somewhere in 88–89.3K (wick above is ok, but no strong 1H close above 89.5K).
•Momentum (1H/30m RSI + MACD) rolls over → that opens the door for:
•First stop: 86.5–86.0K
•Main sweep / CME fill: 85.5–85.0K
•If US doesn’t fade it
•We hold above 86.5–87K on pullbacks.
•Then break and close 1H above 89.5K → that kills the easy fade short and leans toward a larger relief leg (91–93K next).
So intraday:
•Aggro short idea: look for rejection signs in 88–89K with tight invalidation above 89.5–90K, targeting 86.5K → 85.5K.
•Patient long idea: wait for that potential US fade to fill the 85.5–85.0K CME zone and then hunt a reversal long back into 88–90K.
Treat the Sunday–Monday pattern as a bias, not a guarantee – price + levels still rule.
no, it’s not confirmed yet.
On a monthly chart nothing is “confirmed” on MACD until the month closes:
•The signal-line cross and the histogram flip are calculated from the current, still-moving candle.
•As long as the month is open, price can bounce, and those MACD lines can:
•uncross again,
•or flatten out instead of rolling over.
That cros:
•The blue MACD line has curled down and is close to / slightly under the yellow signal line → momentum is weakening.
•Histogram is probably shrinking → early warning of a potential higher-timeframe cool-down.
So:
•Confirmed breakdown? → only if we finish the month with MACD line below the signal line and histogram red.
•Right now? → treat it as a warning, not a finished signal. Intramonth wicks can fully reset this, especially after a big flush like the one to ~80K
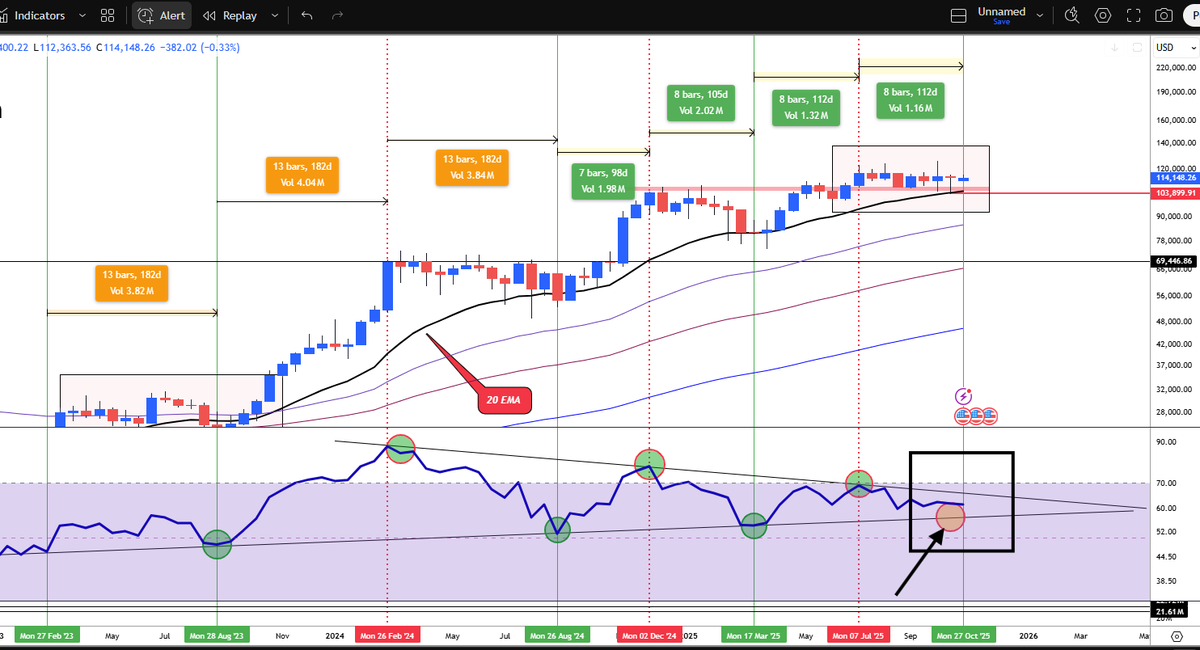
🧠 Bitcoin 2W Chart — Before vs After Close
The beauty of structure 📊 — nothing random here.
🧠 Posted on Oct 23:
“RSI floor rising — momentum reloading at key trendline.
Flat 20 EMA ($97K–$103K) = cycle guardrail.”
⚙️ Today (Oct 28):
* RSI floor ✅ still rising — no breakdown.
* 20EMA (~$97K–$103K) ✅ defended again — cycle backbone intact.
* We’re now 8 bars into the cooling phase, right inside historical symmetry
#BTC #CryptoUltron #Bitcoin
#BTC
🕒 Confirmed Weekly Pattern (visualized on your 6H chart)
•🟢 Sunday evening → Monday morning (EU time):
Consistent pump phase — BTC rallies into liquidity pockets, creating weekend FOMO.
•🔴 Monday evening (US open ≈ 20:00 CET):
Market tends to correct or retrace, fading the earlier pump as US traders rebalance and CME opens.
✅ This has repeated 3 consecutive weeks (highlighted in your green ovals), showing an algorithmic liquidity rotation driven by futures funding resets, CME gap alignment, and RRP/TGA cash cycles.
⸻
🔄 Today’s Deviation (Nov 3 2025)
•❌ No Sunday-evening pump → BTC stayed flat around 109.8K – 110.4K.
•⚠️ That built compressed liquidity without relief → direct Monday-morning EU dump now in progress.
•🩵 If 4H closes above 106.6 – 105.8 K, pattern could reset with a US-session recovery.
•🔴 If 4H closes below 105.8 K, pattern inverts → deeper liquidity grab toward 104 – 103.5 K before next cycle.
🧭 2️⃣ Key validation levels
•Soft zone (retest area): $107.3K – $106.6K → minor wick below here is fine if reclaimed.
•Hard invalidation: 6H or 4H close below $105.8K = confirmed structure break → triggers deeper sweep toward $104K–$103.5K.
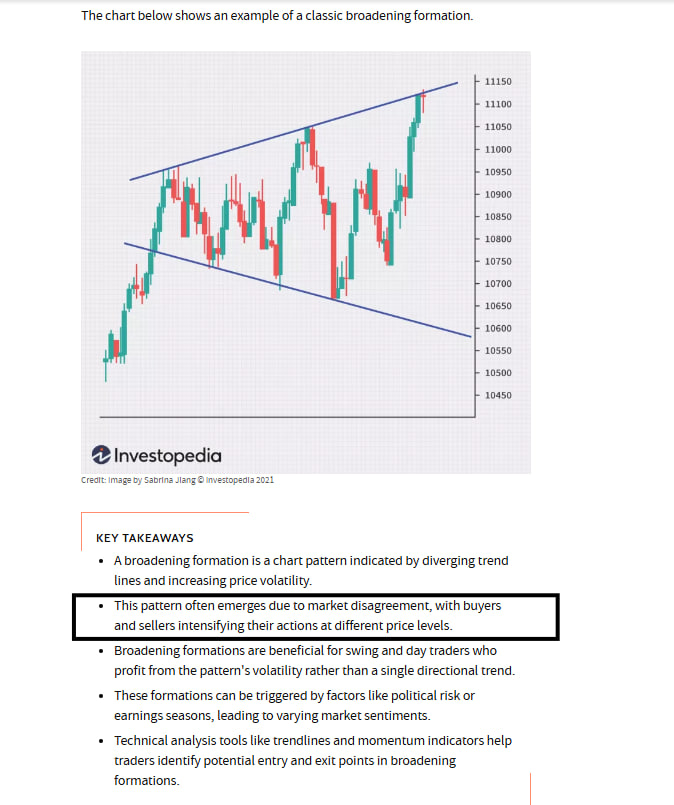
🧠 Pattern Identification: Broadening Formation (Megaphone)
Chart fits Investopedia’s definition precisely:
-📈 Higher pivot highs: the three red arrows (top of the range).
📉 Lower pivot lows: the three green arrows (bottom of the range).
🧭 Diverging trendlines: the upper and lower lines are widening apart — classic volatility expansion.
⚙️ Context: this developed after a major bull run (Jan–Mar 2025) → exactly when broadening structures tend to appear.
🔍 Behavioral Reading
A broadening formation = market disagreement.
Buyers still believe the uptrend isn’t done → chase higher highs.
Sellers fade each rally harder → drive deeper lows.
The result: expanding volatility, with no consensus yet on fair value.
This often marks the late re-accumulation or distribution phase before the next macro move.
It’s the market’s way of shaking out both sides before it trends again.
📊 In BTC’s Case
The 2D structure since June has formed exactly this megaphone range.
The upper bound = $126K zone, lower bound ≈ $98K–$103K.
Midpoint / decision zone: $114.6K (0.382 Fib + EMA cluster).
That’s the level to watch — breakout above it confirms broadening continuation breakout, rejection = another expansion swing down.
🧩 Confluence
RSI shows downward compression while price volatility expands = classic energy build-up inside a broadening formation.
EMA ribbon is acting like a median equilibrium zone — price keeps oscillating around it, showing no clear dominance yet.
🎯 Summary
BTC’s 2D structure = textbook Broadening Formation (megaphone) — signaling heightened volatility and market disagreement after a major rally.
Resolution will come with a decisive 2D close outside the $114.6K–$103K range.
Until then, expect wide swings — perfect for experienced range traders, dangerous for trend followers
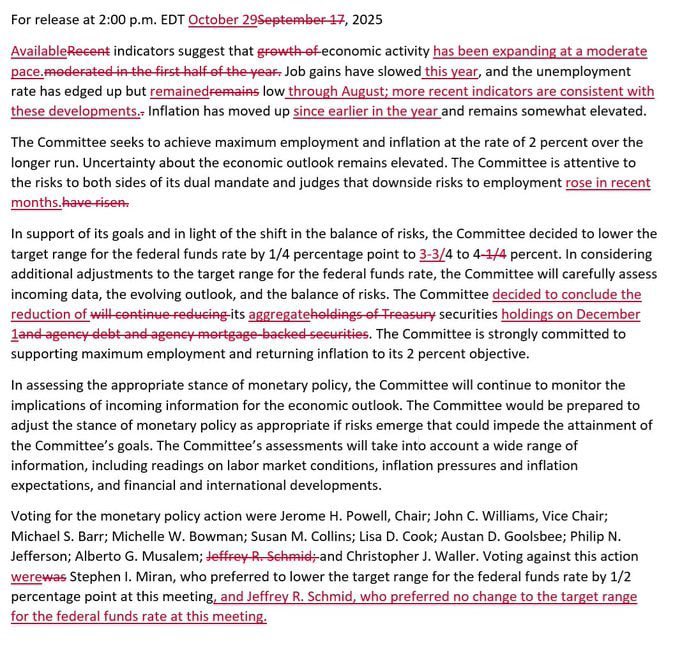
🔎 What the Fed Announced
From first screenshot (FOMC statement), the Fed said it will stop shrinking its balance sheet on December 1, 2025.
• That means the Fed is ending Quantitative Tightening (QT) — the process where it was letting assets (Treasuries, MBS) roll off its balance sheet, effectively draining liquidity from the system.
• The second screenshot (Fed balance sheet graph) shows how total assets surged during COVID, then declined from May 2022 onward. Now, that shrinkage will stop.
⸻
🏦 Macro Meaning
• QT = liquidity drain → less money in the system, usually bearish for risk assets (stocks, crypto).
• Stopping QT = neutral to easing shift → the Fed is no longer removing liquidity, which removes a key headwind.
This doesn’t mean they are actively printing (QE), but it removes a form of tightening. Markets will likely interpret this as dovish / supportive for risk assets.
⸻
📈 Impact on Crypto & Bitcoin
• Bullish tilt: Crypto thrives on liquidity. If the Fed is no longer reducing its balance sheet, downside liquidity pressure on BTC and alts eases.
• Psychological shift: Markets may start pricing in the next step → eventual rate cuts or QE restart, both historically very bullish for Bitcoin.
• Timing matters: If this happens while BTC is already in a strong uptrend, it could act as fuel for continuation.
⸻
⚠️ Caveats
• It’s not outright QE yet — they’re not adding liquidity, just stopping the drain.
• If inflation stays sticky, the Fed may keep rates high even while pausing QT, which can cap risk appetite.
• Reaction will depend on how markets interpret the “pause”: is it a pivot to easing, or just risk control?
⸻
✅ Bottom Line for Bitcoin
• Net bullish: Removing QT headwinds = positive for liquidity-sensitive assets like BTC.
• This sets the stage for a stronger macro rotation into crypto if/when the Fed moves toward actual easing.
• For traders: expect volatility spikes around Dec 1, but structurally this supports the bull case.
🧠 Bitcoin 2W Chart — Before vs After Close
The beauty of structure 📊 — nothing random here.
🧠 Posted on Oct 23:
“RSI floor rising — momentum reloading at key trendline.
Flat 20 EMA ($97K–$103K) = cycle guardrail.”
⚙️ Today (Oct 28):
* RSI floor ✅ still rising — no breakdown.
* 20EMA (~$97K–$103K) ✅ defended again — cycle backbone intact.
* We’re now 8 bars into the cooling phase, right inside historical symmetry
#BTC #CryptoUltron #Bitcoin
🔑 #Bitcoin 2W Chart—Key Observations
📈 RSI Floor Rising
Momentum keeps resetting higher — every dip reloads without breaking structure. Hidden strength building under the surface.
🧭 Flat 20 EMA ($97K–$103K) → cycle guardrail.
Holding above = trend intact. Lose it = macro cooling.
⏱️ Time Symmetry = Market Rhythm
Every BTC expansion cycle so far:
→ ~13 bars of compression before a new ATH
→ ~7–8 bars of cooling before the next leg
We’re exactly 7 bars into this correction, sitting right at the key RSI trendline — the same support that launched every prior expansion wave.
⚡ If rhythm repeats → BTC is nearing the next breakout inflection.
Stay patient, structure is doing its job.
#BTC #CryptoUltron
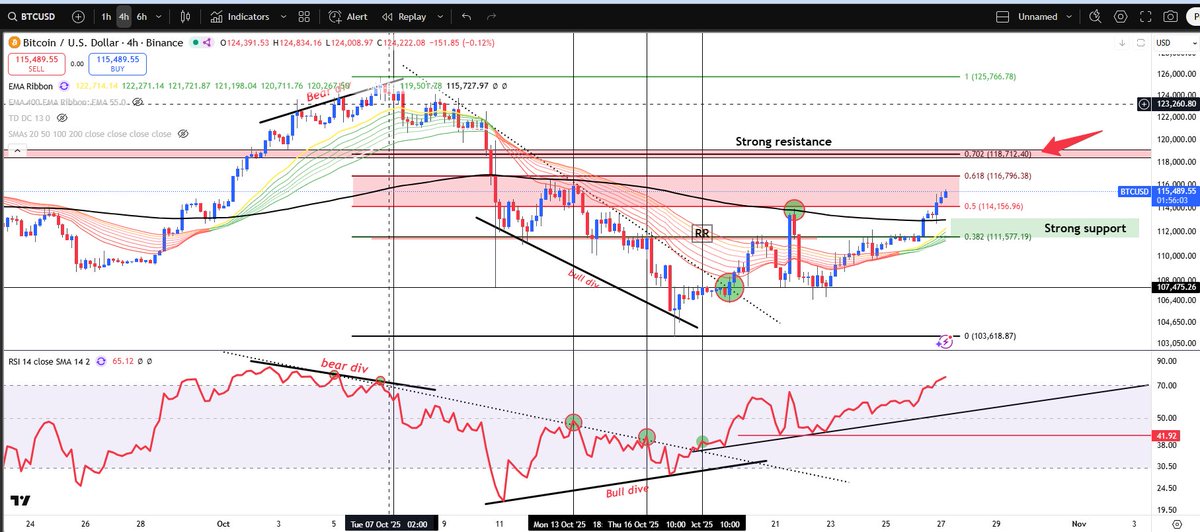
⚡️ BTC Market Plan: Oct 27 — Execution --> Extension The Oct 20 Roadmap Complete. Time to Reload.
⸻
🔄 The previous plan (Oct 20) was executed flawlessly: BTC reclaimed 113.5K and pushed toward 115.4K.
Trend Status: The Weekly candle closed strong, reclaiming the EMA cluster (111K–114K). Bullish trend is repaired; momentum is restored.
Trade Profit: Spot/Swing positions initiated in the 108K–110K zone are now sitting at a healthy +4% to +10% profit—exactly following the liquidity sweep → reclaim → expansion model.
⸻
🧭 Structure (multi-TF read)
• Weekly candle green above EMA12/20 (113 – 114 K); buyers in control.
• 3D engulfing reversal off 102.5 K → EMA ribbon reclaim → momentum curling up.
• Daily MACD bullish cross ✅ RSI ≈ 69 = trending but hot.
• 4H/12H RSI high 80s → expect short pullback to 114.2 – 113.5 K before next push.
• 1H/15m cooling → micro double-top at 115.4 K resetting oscillators.
Summary = bullish but overextended. Healthy retest first → then 116 – 118 K extension.
⸻
🕒 Timeline
• Monday–Tuesday → pullback window 113.5 – 114 K.
• Tuesday–Wednesday → attempt toward 116 – 118 K.
• Weekly close > 116 K → momentum expands → 120 K next.
⸻
🧠 Summary
BTC executed the Oct 20 roadmap to the dot — liquidity sweep, reclaim, and push up.
Trend remains bullish but short-term hot.
Base case = controlled dip to 114 K zone → continuation 116 – 118 K.
Only invalid if D close < 111.8 K.
Stay patient, trade edges, don’t chase middles.
🎯 Execution map ← Read below the next post
As always — don’t blindly follow me 😉 I just read the charts.
Smash that ❤️ Like & RT,
and make sure to follow to keep this energy going!
#CryptoUltron ⚡
⚡️ BTC Market Plan: Oct 27 — Execution --> Extension The Oct 20 Roadmap Complete. Time to Reload.
⸻
🔄 The previous plan (Oct 20) was executed flawlessly: BTC reclaimed 113.5K and pushed toward 115.4K.
Trend Status: The Weekly candle closed strong, reclaiming the EMA cluster (111K–114K). Bullish trend is repaired; momentum is restored.
Trade Profit: Spot/Swing positions initiated in the 108K–110K zone are now sitting at a healthy +4% to +10% profit—exactly following the liquidity sweep → reclaim → expansion model.
⸻
🧭 Structure (multi-TF read)
• Weekly candle green above EMA12/20 (113 – 114 K); buyers in control.
• 3D engulfing reversal off 102.5 K → EMA ribbon reclaim → momentum curling up.
• Daily MACD bullish cross ✅ RSI ≈ 69 = trending but hot.
• 4H/12H RSI high 80s → expect short pullback to 114.2 – 113.5 K before next push.
• 1H/15m cooling → micro double-top at 115.4 K resetting oscillators.
Summary = bullish but overextended. Healthy retest first → then 116 – 118 K extension.
⸻
🕒 Timeline
• Monday–Tuesday → pullback window 113.5 – 114 K.
• Tuesday–Wednesday → attempt toward 116 – 118 K.
• Weekly close > 116 K → momentum expands → 120 K next.
⸻
🧠 Summary
BTC executed the Oct 20 roadmap to the dot — liquidity sweep, reclaim, and push up.
Trend remains bullish but short-term hot.
Base case = controlled dip to 114 K zone → continuation 116 – 118 K.
Only invalid if D close < 111.8 K.
Stay patient, trade edges, don’t chase middles.
🎯 Execution map ← Read below the next post
As always — don’t blindly follow me 😉 I just read the charts.
Smash that ❤️ Like & RT,
and make sure to follow to keep this energy going!
#CryptoUltron ⚡
⚡️ BTC Market Plan: Oct 27 — Execution --> Extension The Oct 20 Roadmap Complete. Time to Reload.
⸻
🔄 The previous plan (Oct 20) was executed flawlessly: BTC reclaimed 113.5K and pushed toward 115.4K.
Trend Status: The Weekly candle closed strong, reclaiming the EMA cluster (111K–114K). Bullish trend is repaired; momentum is restored.
Trade Profit: Spot/Swing positions initiated in the 108K–110K zone are now sitting at a healthy +4% to +10% profit—exactly following the liquidity sweep → reclaim → expansion model.
⸻
🧭 Structure (multi-TF read)
• Weekly candle green above EMA12/20 (113 – 114 K); buyers in control.
• 3D engulfing reversal off 102.5 K → EMA ribbon reclaim → momentum curling up.
• Daily MACD bullish cross ✅ RSI ≈ 69 = trending but hot.
• 4H/12H RSI high 80s → expect short pullback to 114.2 – 113.5 K before next push.
• 1H/15m cooling → micro double-top at 115.4 K resetting oscillators.
Summary = bullish but overextended. Healthy retest first → then 116 – 118 K extension.
⸻
🕒 Timeline
• Monday–Tuesday → pullback window 113.5 – 114 K.
• Tuesday–Wednesday → attempt toward 116 – 118 K.
• Weekly close > 116 K → momentum expands → 120 K next.
⸻
🧠 Summary
BTC executed the Oct 20 roadmap to the dot — liquidity sweep, reclaim, and push up.
Trend remains bullish but short-term hot.
Base case = controlled dip to 114 K zone → continuation 116 – 118 K.
Only invalid if D close < 111.8 K.
Stay patient, trade edges, don’t chase middles.
🎯 Execution map ← Read below the next post
As always — don’t blindly follow me 😉 I just read the charts.
Smash that ❤️ Like & RT,
and make sure to follow to keep this energy going!
#CryptoUltron ⚡
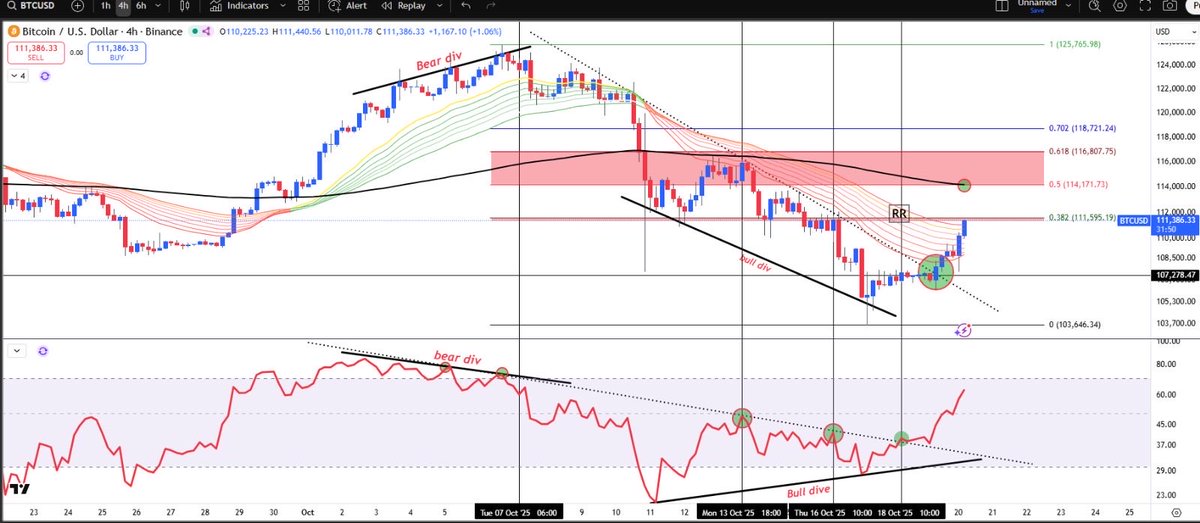
✅ BTC Market Update & Plan — 20 Oct (continuity from Oct 11)
⸻
🔄 Since the Oct 11 update (what actually happened)
•Plan said: reject 115–116K → 109/105/102.5K sweep risk; reclaim ≥116K for squeeze.
•We rejected 116K, flushed to 103.5–102.5K (3D/1D wick confluence), then mean-reverted back to 111–112K.
•Currently trading around 111.1–111.3K, testing the underside of 4H/1D EMA cluster. Still below heavy daily EMAs (EMA20 ≈ 113K, EMA50/60 ≈ 114K) → bounce into resistance, not a confirmed trend flip.
🧭 Structure
•BTC reclaimed short-term structure but still below daily EMA 20–50 (113–114K).
•Until we close >114.2–116K, it’s a relief rally inside resistance, not trend continuation.
🧩 Scenarios (probabilities)
Base case (55%) — Range repair
•Ping-pong between 110.4–113.5K.
•First probe into 111.6–112.2K likely fades; if momentum holds, 113.3–114.2K gets tagged then rejected on first touch.
Bear extension (25%) — One more downside sweep
•Acceptance <111K → quick tag of 110.0/109.7K.
•Lose 109.7K with volume → 108.7K → 107.6K liquidity sweep. Max pain retest 105–102.5K if daily closes weak.
Bull reclaim (20%) — True squeeze
•Daily close ≥113.5K = first reclaim (early long).
•Daily close ≥114.2–116K with OBV uptick = trend continuation → 118.2 → 120 → 123–124.6K.
⸻
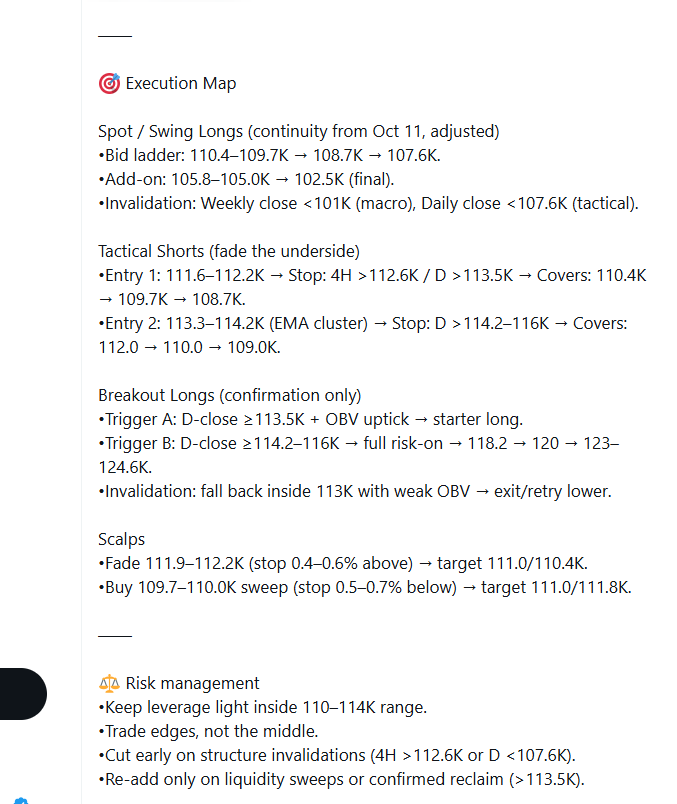
🎯 Execution Map
Spot / Swing Longs (continuity from Oct 11, adjusted)
•Bid ladder: 110.4–109.7K → 108.7K → 107.6K.
•Add-on: 105.8–105.0K → 102.5K (final).
•Invalidation: Weekly close <101K (macro), Daily close <107.6K (tactical).
Tactical Shorts (fade the underside)
•Entry 1: 111.6–112.2K → Stop: 4H >112.6K / D >113.5K → Covers: 110.4K → 109.7K → 108.7K.
•Entry 2: 113.3–114.2K (EMA cluster) → Stop: D >114.2–116K → Covers: 112.0 → 110.0 → 109.0K.
Breakout Longs (confirmation only)
•Trigger A: D-close ≥113.5K + OBV uptick → starter long.
•Trigger B: D-close ≥114.2–116K → full risk-on → 118.2 → 120 → 123–124.6K.
•Invalidation: fall back inside 113K with weak OBV → exit/retry lower.
Scalps
•Fade 111.9–112.2K (stop 0.4–0.6% above) → target 111.0/110.4K.
•Buy 109.7–110.0K sweep (stop 0.5–0.7% below) → target 111.0/111.8K.
⸻
⚖️ Risk management
•Keep leverage light inside 110–114K range.
•Trade edges, not the middle.
•Cut early on structure invalidations (4H >112.6K or D <107.6K).
•Re-add only on liquidity sweeps or confirmed reclaim (>113.5K).
⸻
🕒 Timeline
•Daily close: >113.5K = opens door to 114.2–116K.
Rejection under 112.2K = keeps bias to downside sweeps.
Sunday night: market pumps or recovers (low liquidity)
•Monday U.S. open: volatility spike → dump retrace before new direction
If that pattern repeats, expect 111.6–113.5K to be the trap zone for another short-term fade before any real continuation.
🔄 Bias flip triggers
•Bullish: D-close >113.5K + OBV uptick + thinning sell walls at 114K+.
•Bearish: D-acceptance <111K or rejection at 112–113K with lower highs → opens 109–105K range.
⸻
✅ Summary
That dump was a liquidity hunt, not a structural break.
BTC recovered from the 102.5K sweep and is now retesting resistance at 111–113K.
Until 114.2–116K is reclaimed, treat this bounce as a range repair, not breakout.
🎯 #BTC Execution Map (continuity from Oct 20 update)
💎 Spot / Swing Longs
These new bid zones are for traders who missed the Oct 20 setup.
Those who followed the previous 🎯 map should already be in profit and now use this week’s plan as defense mode — to protect gains and manage continuation entries.
• Primary bids: 114.2–113.8K → add 112.3K if 113.5K fails briefly.
• Deeper sweep adds: 111.0K → 109.0K.
• 🎯 TP ladder: 116.6K → 118.2K → 120K (leave runner for 123–124.6K).
• ❌ Invalidation:
– Tactical: 4H < 112.3K → trim/reload lower.
– Daily < 111.8K → step aside; revisit 110.8/109K.
🔻 Tactical Shorts (until proven otherwise at ceiling)
• Entry 1: 115.8–116.6K (first-touch fade).
• Stop: 4H > 116.8K or D > 116.6K + OBV uptick.
• Covers: 114.6K → 114.0K → 113.5K.
• Entry 2 (if parabolic): 118.0–118.5K.
• Stop: D > 118.6–119K → cover 116.6/115.8K.
⚡ Breakout Longs (confirmation only)
• Trigger A: 4H ≥ 116.0K + OBV uptick → target 118.2K; stop < 115.2K.
• Trigger B: Daily ≥ 116.6K → 118.2 → 120K → trail below last 4H HL.
💥 Scalps (intraday)
• Buy 114.2–114.0K (0.5–0.7 % SL) → take 114.9–115.3K.
• Fade 115.8–116.2K (0.4–0.6 % SL) → take 115.0–114.5K.
🟢 Trade Performance (since Oct 20 plan)
• Spot/swing bids from 110.4 – 109 K → 108.7 K are now +4 – 6 K in profit (+4 – 6%).
• Even deeper fills below 108 K yielded +7 – 10% moves.
• Setup executed exactly as planned — liquidity sweep → reclaim → expansion.
• Now we protect profits and reload higher at 114 K support for next leg up.
⚠️ RISK PROFILE: What Could Go Wrong?
Ceiling Traps: The 115.8K–116.6K zone is a notorious liquidity wall. DO NOT CHASE breakouts here; wait for confirmation or fade the first attempt.
Pullback Depth: If 113.5K is lost, the market may sweep deeper to 112.3K. Acceptance below that opens the 109K–111K "air gap."
D-Close $< 111.8K$ is the structural fail point.
✅ BTC Tomorrow full update again after weekly close! For now 👇👇
Update Recap — Oct 11 → Oct 20 → Now
🔄 Oct 11 Plan:
Reject 115–116K → dump to 109/105/102.5K sweep.
▶️ Nailed it: rejection at 116K, flush to 103.5–102.5K, floor at 102.3K held.
🧭 Oct 20 Update:
Post-sweep bounce → mapped 111–113.5K = trap zone.
•Only reclaim >114.2–116K = breakout
•Otherwise = range repair
•Tactical shorts inside 111.6–114.2K, stops >116K.
📉 Since Then:
•Bounce topped inside 111–113K resistance.
•Rejected exactly at the red zone.
•Still capped under daily EMAs → no breakout yet.
•Current ~111.5K = just range repair, not trend flip.
⸻
✅ Verdict:
Oct 11 = caught the dump.
Oct 20 = called the bounce + rejection zone.
Plan respected, no invalidation hit.
⸻
⚡ Note:
Macro outlook hasn’t changed. This is just a mid-range update for you guys to play levels.