Oil is screaming inflation. The bond market isn't listening.
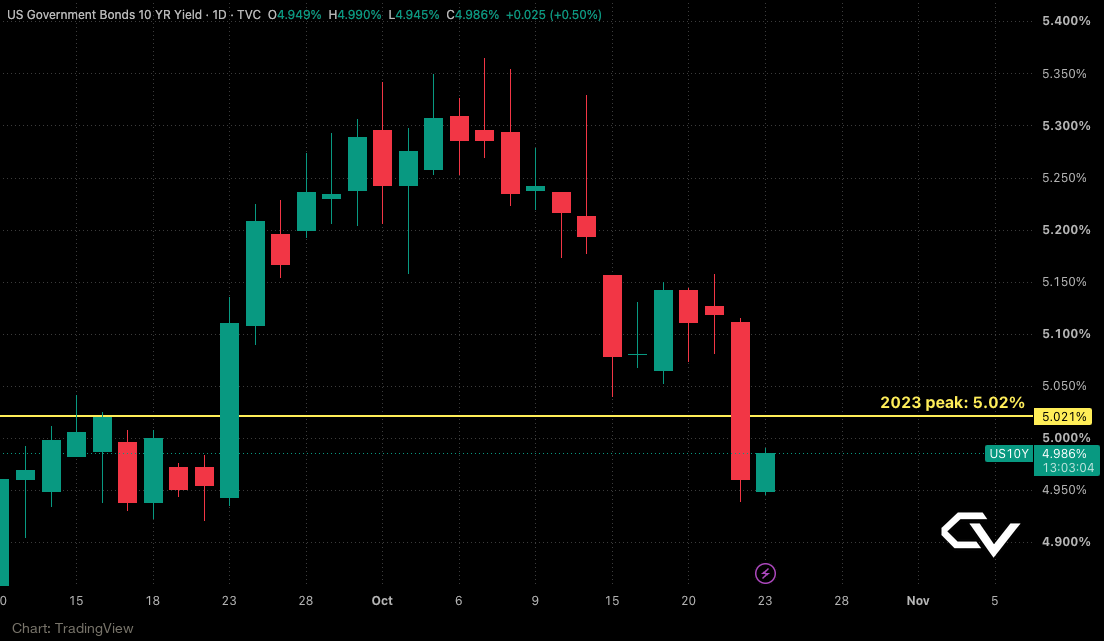
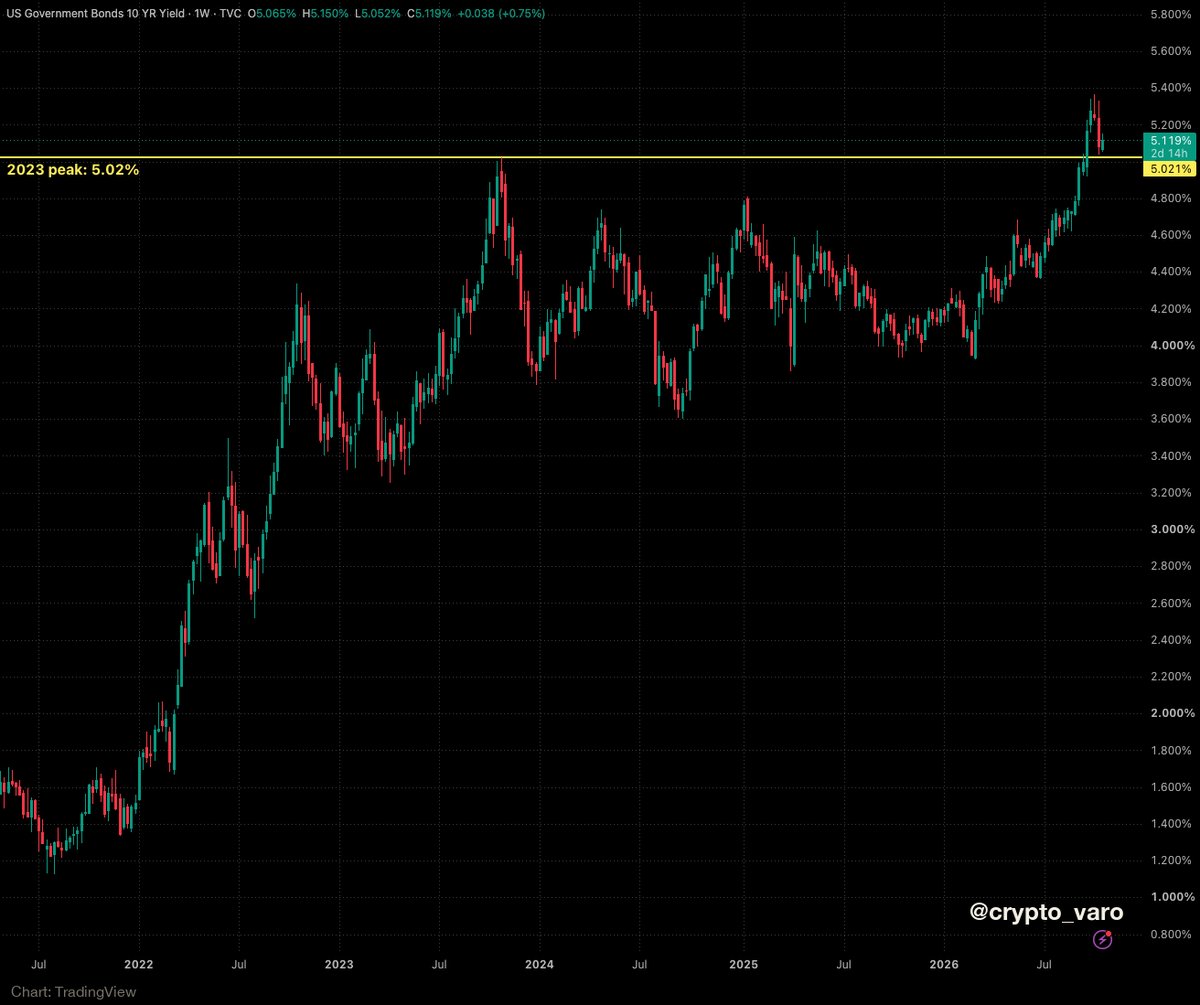
Brent is above $110. Yet the 10Y just fell back under its 2023 peak of 5.02%.
If oil were really a rates problem, yields would be ripping. They're not.
For $BTC, yields matter more than barrels. Yields just blinked.
Bitcoin ETFs this week:
Oct 19: +$526.7M
Oct 20: +$23.2M
Oct 21: +$524.8M
Oct 22: −$635.6M
Three days in. One day out. And it wasn't one fund: IBIT −$254.1M, FBTC −$217.5M, ARKB −$109.4M.
Blip, or the trend turning?
October so far (Oct 1 → Oct 21):
$BTC +0.6%
$ETH -7.9%
$XRP -8.4%
$SOL -9.5%
BTC went nowhere and still beat every major alt by 8+ points.
That's not alt season. That's money hiding in the safest asset crypto has.
Alts need BTC to break out first. Not the other way around.
China wants 61,896 BTC back.
UK police seized them from Qian Zhimin, who fled China in 2017 after a Ponzi scheme hit 102,000+ investors.
Now a Tianjin court has filed to confiscate them. ~$5.1B at today's price.
Who should end up with the coins?
$BTC drawdown from its all-time high, every bear:
2018: -84%
2022: -77%
This one: -53% (June 30 close)
Now: about -35% from the $124.7K high.
Either the bottom is in and this was the shallowest bear yet, or June gets retested.
$58.5K is the line that decides it.
Is Uptober real? $BTC in October since 2015:
9 of 11 Octobers closed green.
Average: +19.1%. Median: +14.4%.
Best: 2017, +48.5%. Worst: 2018, −4.6%.
October 2026 so far: +0.6%, with ten days left.
Seasonality is a tailwind, not a trade. Do you trust it this year?
US jobless claims drop at 12:30 UTC.
The backdrop: the 10Y is around 5.1%, above its 2023 peak of 5.02%.
A soft print gives the Fed room. A hot one pushes yields higher, and higher yields squeeze every risk asset, $BTC included.
This is the chart I'm watching today.
The biggest fee earners in crypto, last 30 days:
1. Tether: $523.7M
2. Circle: $212.2M
3. PumpSwap: $116.3M
4. Polymarket US: $84.1M
5. Hyperliquid: $82.4M
The top two aren't chains or DeFi apps. They issue dollars.
Crypto's best business is still the dollar.
$BTC in ~30 hours:
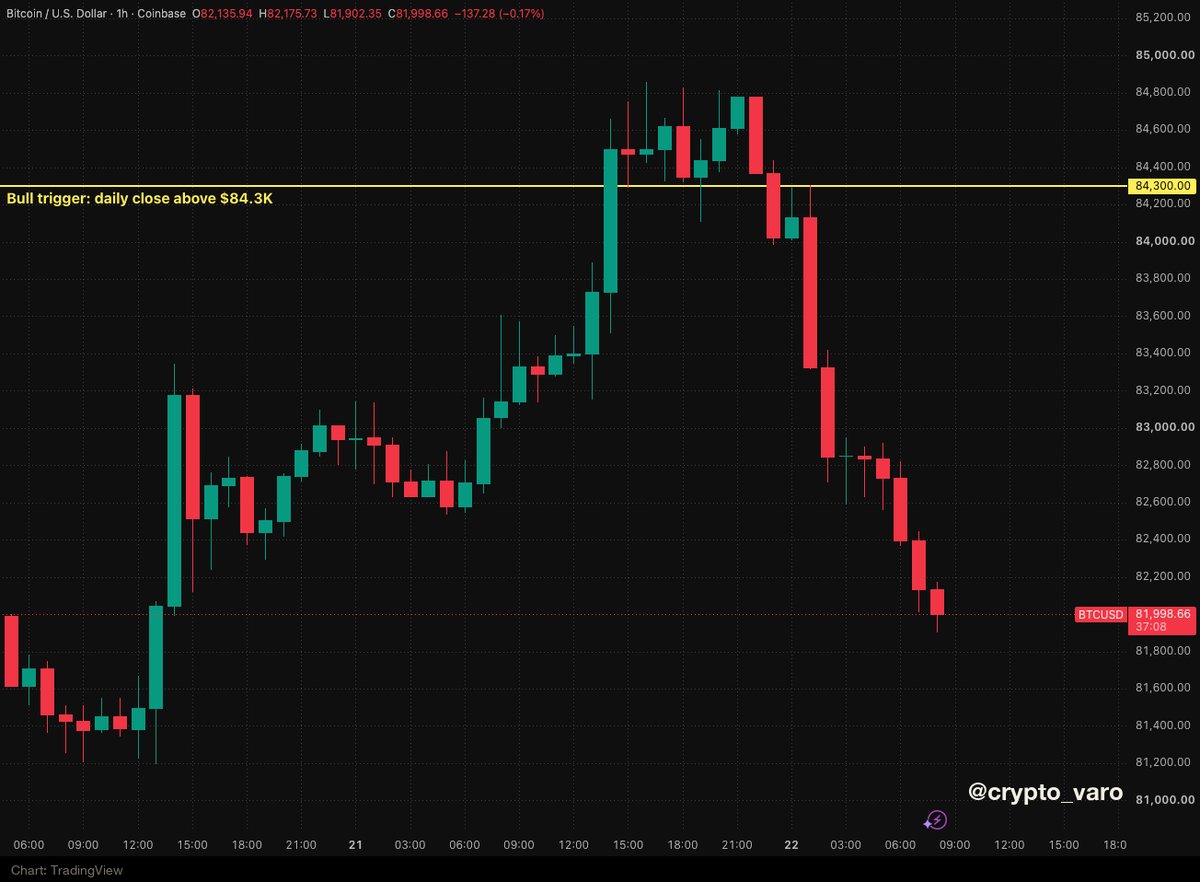
$82.5K → $84.86K → $82K.
Shorts squeezed on the way up. Longs flushed on the way down. Both sides paid.
That's what a range does. It punishes whoever is certain.
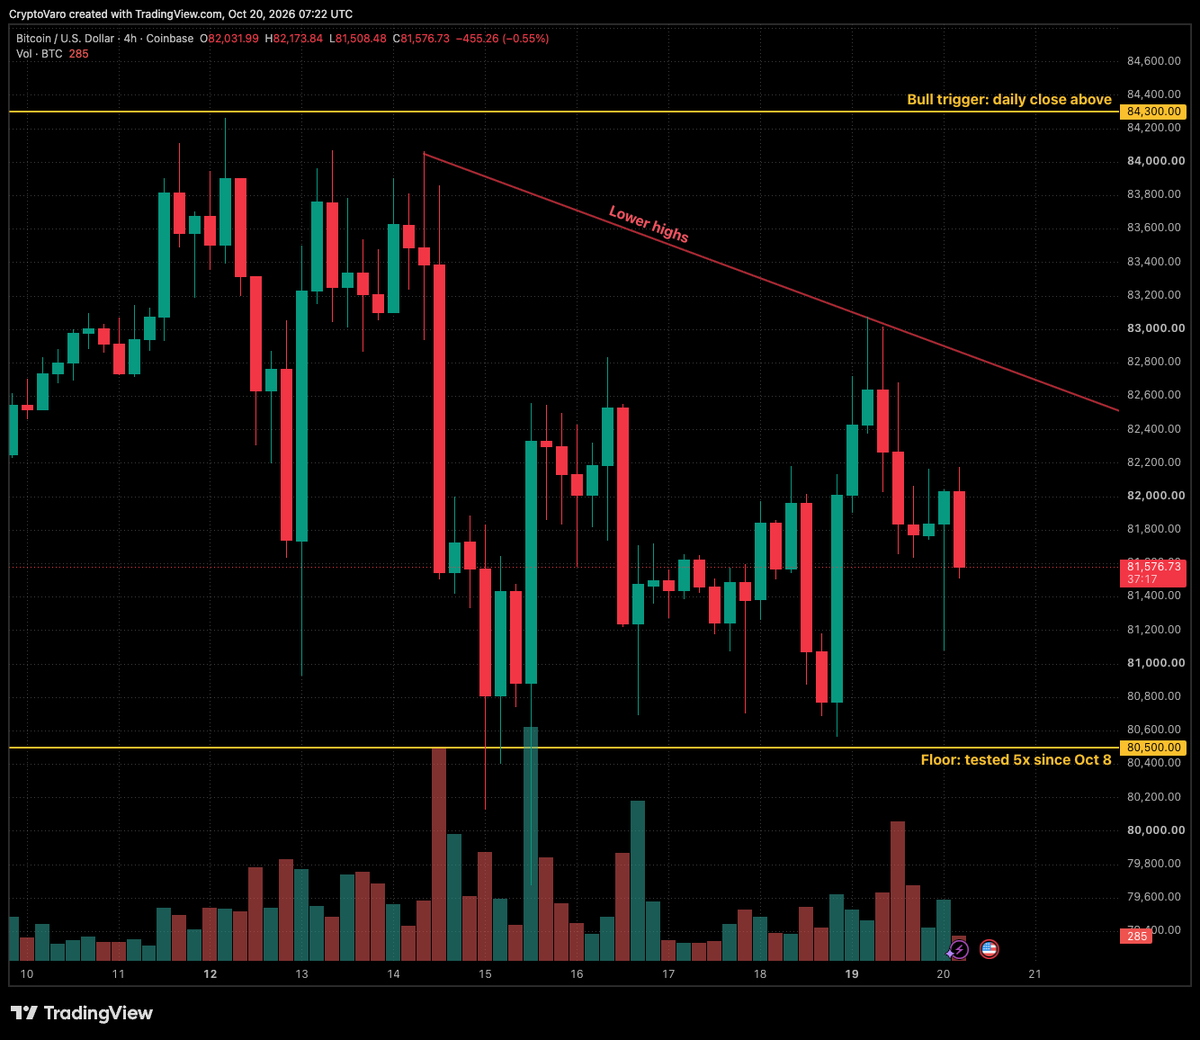
I'm not trading the middle. $80.5K or $84.3K, then we talk.
$7.9B of stablecoins is gone since Jan 1. Nobody's talking about it.
USDT: −2.2% YTD
USDC: −4.9% YTD
Stablecoins are this market's dry powder. Less of it means less fuel for the next leg up.
Where does the next wave of buying come from?
Only one major coin is green in 2026. It’s not Bitcoin.
January: $DOGE led at +29.4%.
June 25: all ten red. Best: $BTC, −31.8%.
Today: only $LINK is green (+2.5%). $BTC is 2nd (−4.0%).
231 of 295 days, all ten sat below Jan 1.
Who leads on Dec 31?
Bitcoin's deepest drop, cycle by cycle (daily closes):
2017–18: −83.8%
2021–22: −76.7%
2025–26: −53.1% (so far)
$124.7K in October 2025 → $58.5K on June 30. Up 43.6% since.
Smaller crashes. Bigger money. Different market.
Was −53% the bottom, or just the first leg?
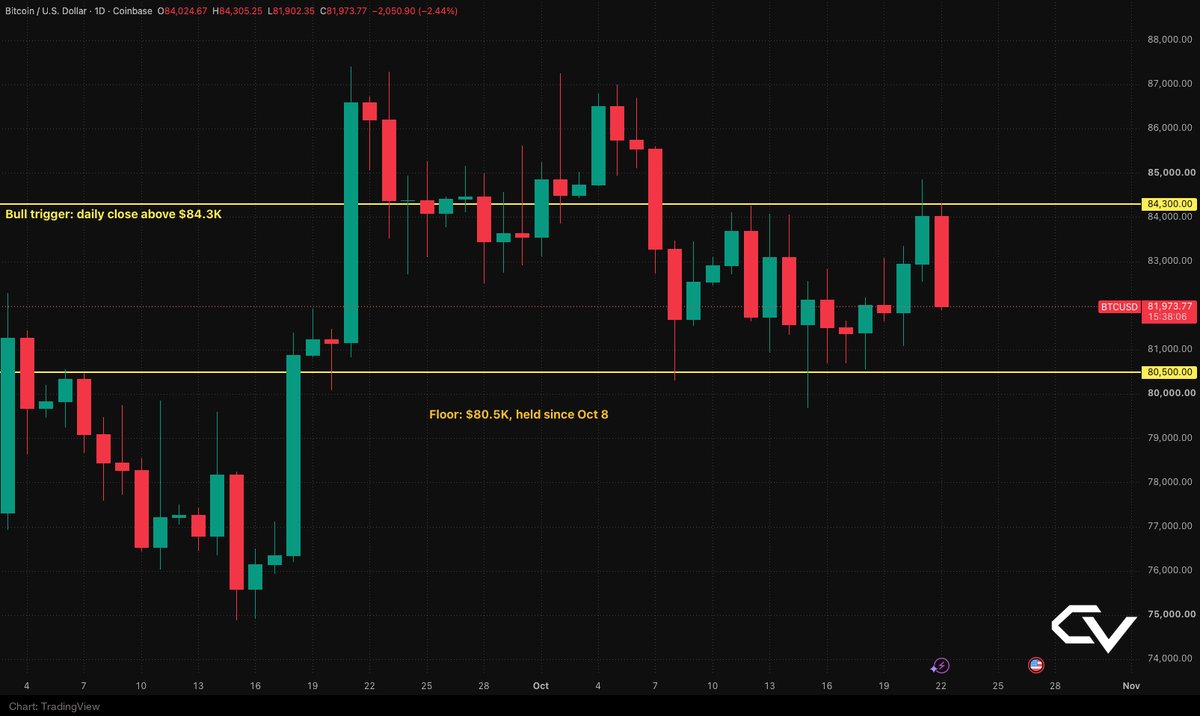
Update: $BTC tagged $84.86K yesterday, but the daily closed at $84,025.
Below the $84.3K trigger. No breakout.
Now back near $82K, inside the same range.
Bull: a daily close above $84.3K still flips it.
Bear: lose $80.5K and the range low is gone.
Alpenglow is live on Solana.
TowerBFT retired at slot 459,653,000.
Finality: 12.8s → 150ms. Roughly 85x faster.
$SOL in the first hour after launch: +0.9%.
A new consensus engine, and the market shrugged.
Priced in, or not priced in at all?
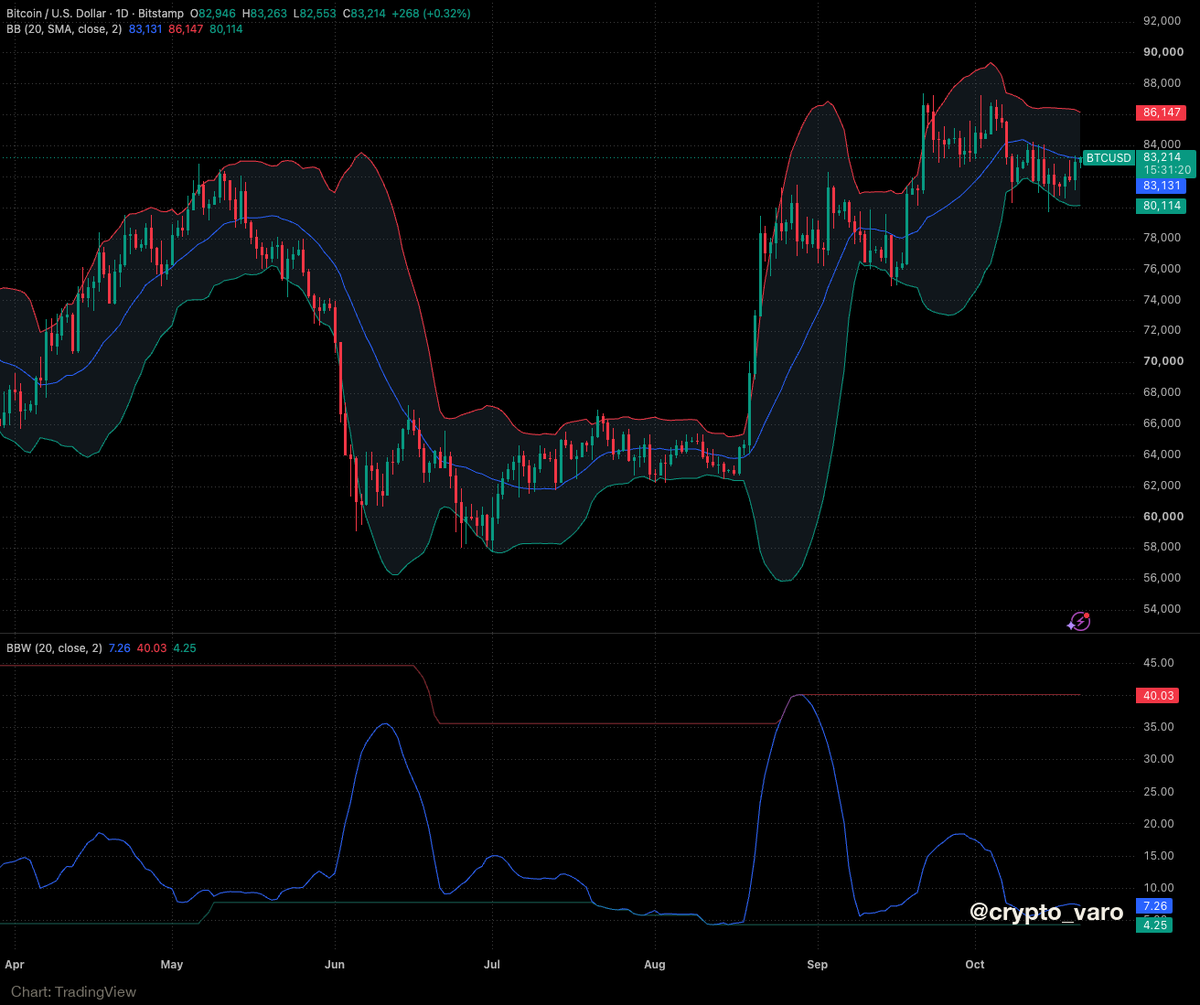
Every big $BTC move this year started the same way: the Bollinger Bands squeezed tight first.
July: bands flat for weeks. Then +39% in seven weeks.
The bands are narrowing again now.
A squeeze doesn't tell you the direction. It tells you a move is coming.
Crypto traders are watching the wrong chart.
Brent is back at $110, the September high. Up ~40% since early August.
Higher oil = stickier inflation = a Fed that can't ease.
EIA inventory data hits at 14:30 UTC. If Brent breaks above $110, risk assets feel it. $BTC included.
$ETH vs $BTC in 2026:
Summer low: ETH −47.2%, BTC −33.1%
Since that low: ETH +56.3%, BTC +41.7%
Year to date: ETH −17.5%, BTC −5.2%
ETH fell harder and bounced harder.
It's still further behind.
Does $ETH catch up in Q4, or is this just high beta both ways?
The most important line on the $BTC chart: the 200-week moving average.
2022: price lost it and spent months below.
2026: price tagged it ($57.7K low, July 1) and bounced 44%.
It now sits at ~$67.2K.
As long as $BTC holds above it, the cycle isn't broken.
Yesterday I said: until $83.1K breaks, sellers have the short term.
The downtrend line just broke and $BTC is pushing into $83.1K now.
Next test: $84K-84.3K, where every push this month got sold.
Bull: daily close above $84.3K.
Bear: lose $80.5K.
No Fed speakers until the Oct 28 decision. The blackout started Oct 17.
This week $BTC trades on data: jobless claims Thursday, PMIs Friday.
4H: every rally since Oct 12 stalled lower. Until $83.1K breaks, sellers have the short term.
Not chasing anything inside this range.
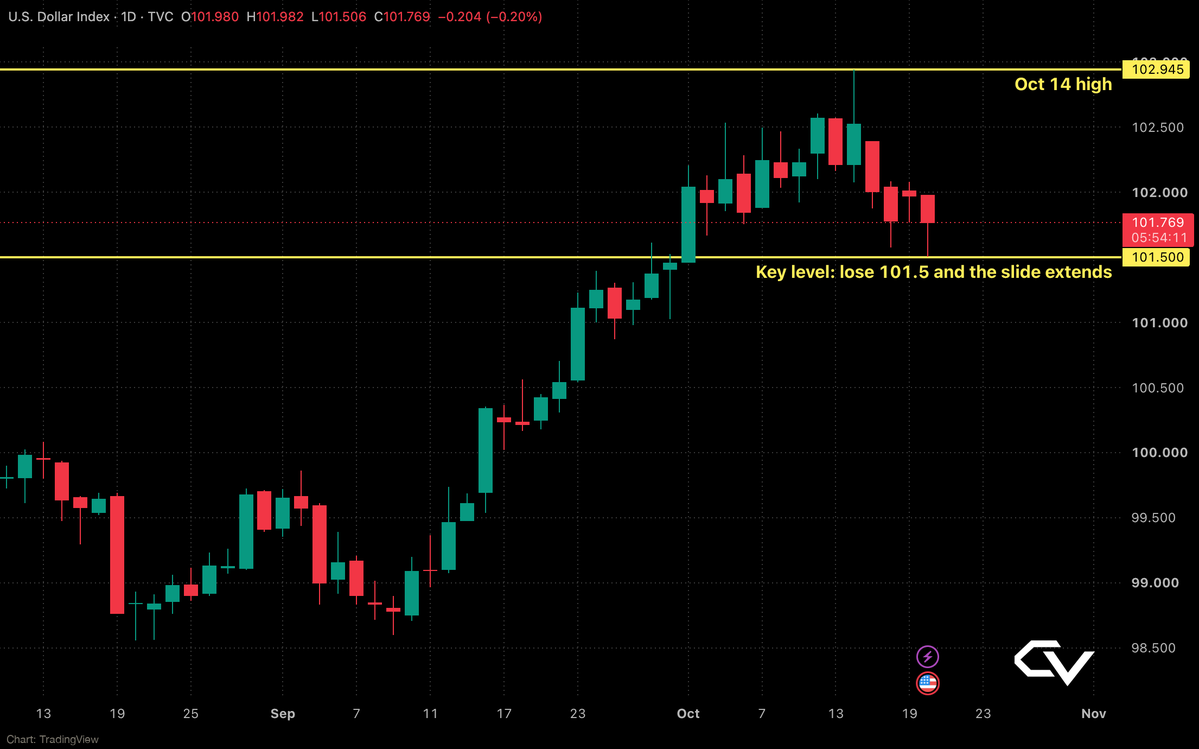
The dollar is rolling over.
$DXY topped at 102.95 on Oct 14. Now ~101.8, a 3-week low. The US 10Y is still above 5.1%.
Falling dollar + high yields isn't a hawkish Fed winning. It's bond market stress.
If DXY loses 101.5, watch whether $BTC can finally clear $84K.