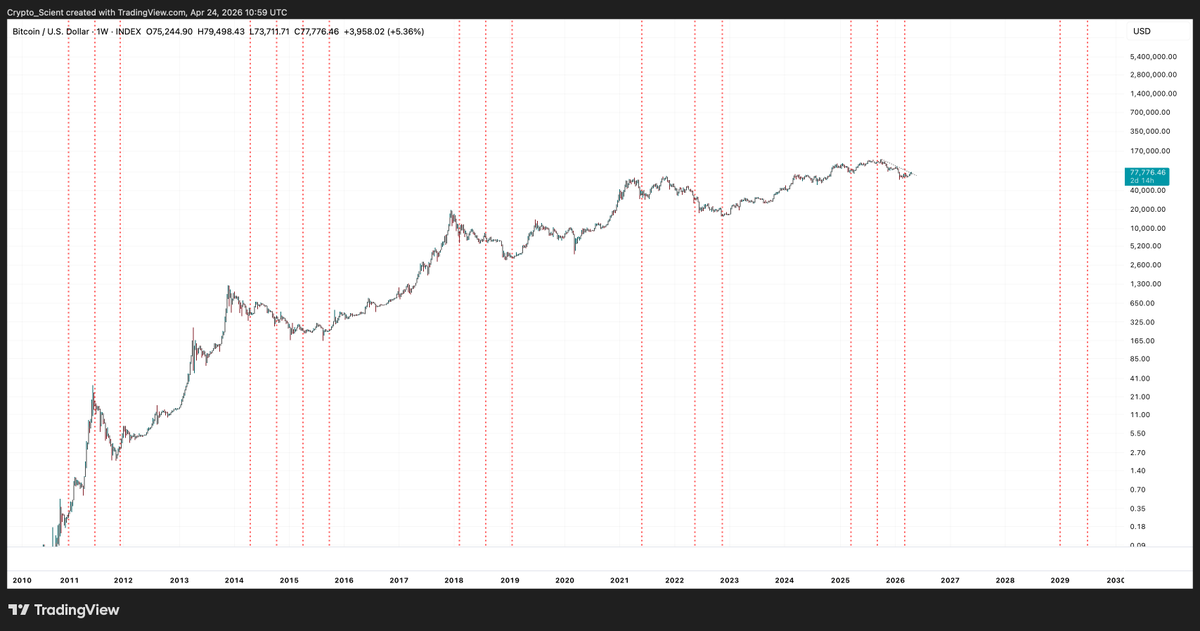
#Bitcoin bottom is in according to the blood moon cycle.
Not sometimes. But this has worked **4 out of 4 cycles. 100% hit rate.**
I’m not into astrology. But I am religious, and I do believe the universe operates on energy. The sun and moon are major sources of that energy — and when these cycles peak, human emotions peak or destabilize.
Peak Euphoria near first blood moon and Peak fear near the last blood moon of the cycle.
The latest blood moon cluster:
March 2025 (Macro range highs $108k)
September 2025
March 2026 (Current swing lows $60k)
Next blood moon: July 2028
Period between every blood moon cluster has been a Bull RUN. That's 24 months of uptrend if the trend is intact.
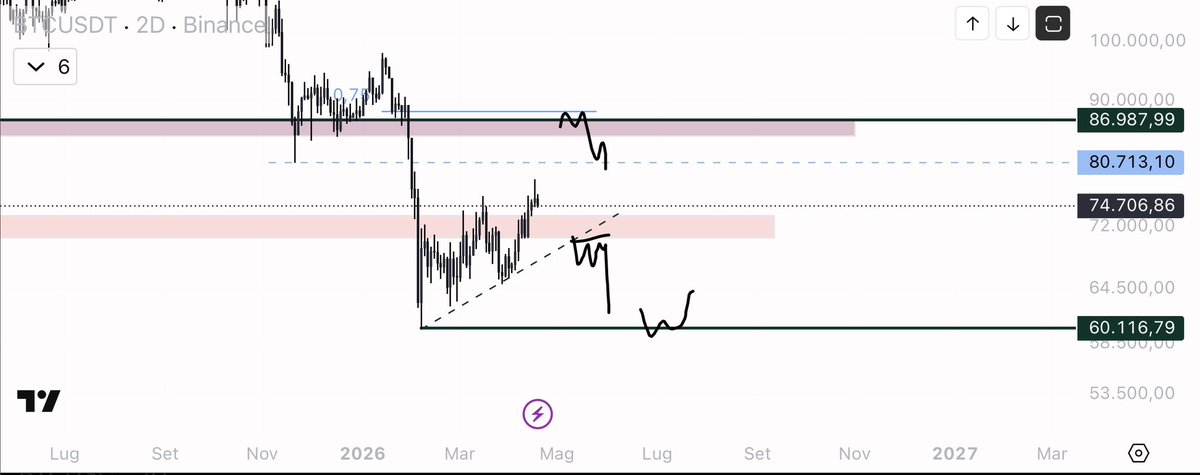
Now aligning this with current price action:
• Macro downtrend broken.
• Range reclaimed.
• Daily structure turning bullish.
I would take this seriously. Overall, my actions in the books are solely based on what the TA says not this but this is some good shit.
Saw a reel on Instagram on blood moons and their correlation with markets and decided to put it to test on BTC chart.
Very surprised.
$BTC Here, I’m observing the market from a distance. As for the scalping we do on a daily basis, that’s a different story; we trade on lower timeframes based on deviations and levels derived from Monday’s range.
I clear the chart, mark a few key levels and wait for the price to come to me. I don’t anticipate anything: I only react when the market reaches areas where it has to make a decision.
Above, I look for weakness; below, I know where it can go if the structure breaks down. In between? Noise.
Fewer trades, but meaningful ones.
The direction emerges on higher timeframes; I refine the entry on lower ones.
Market Bottom Signals Indicated by Long-Term Holder Capitulation
“While it may be early to identify the current market as the bottom, a phase in which losses become widespread would likely represent the final stage of fear & the beginning of opportunity.” – By @DanCoinInvestor
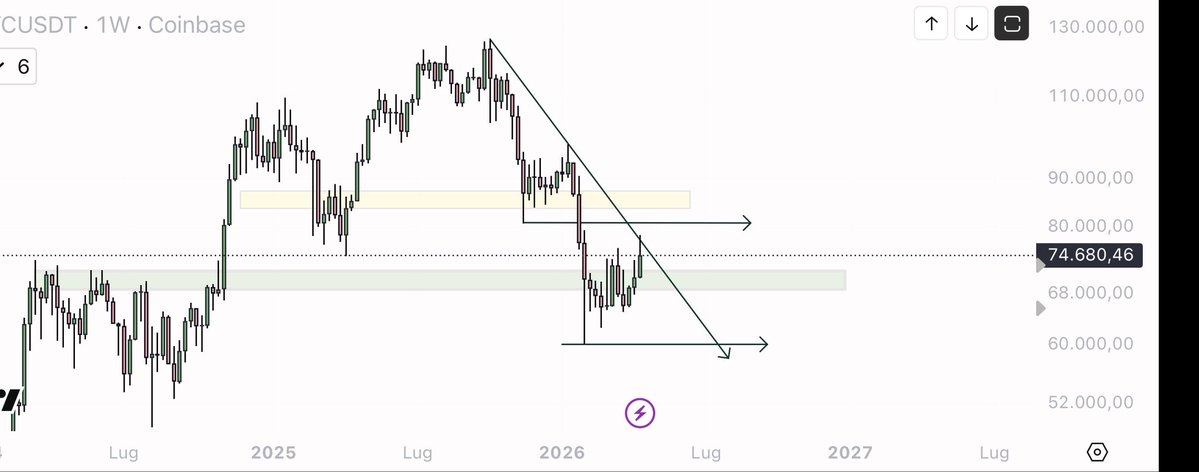
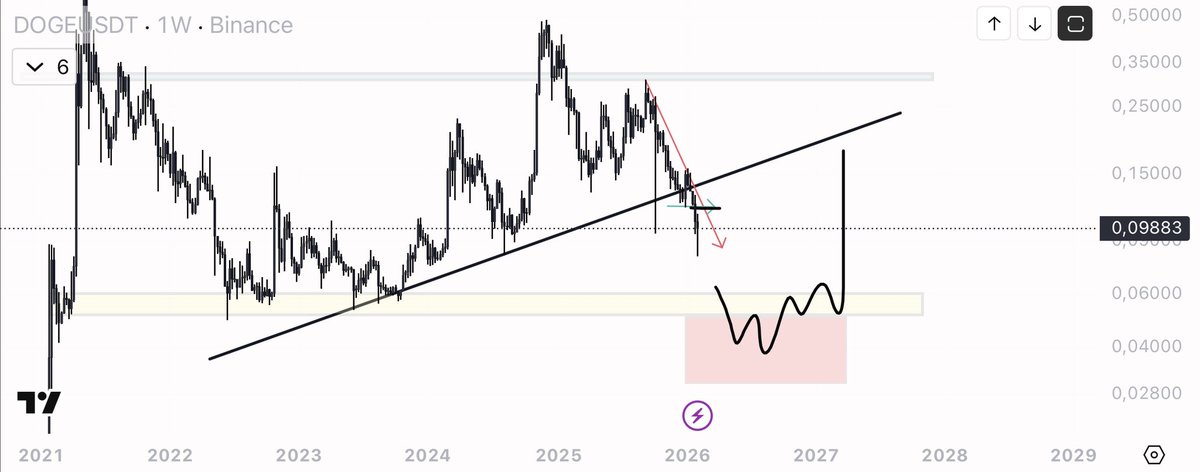
$BTC MACRO PLAN
This is more or less how I expect the coming months to unfold.
• $50k demand is likely to get tested.
• And the fair value gap around $45k remains a magnet below.
I expect that region to be filled before a meaningful bottom forms.
The market rarely leaves inefficiencies behind.
Patience until higher timeframe demand is properly reclaimed.
Going to be hyperactive on X once we are close to $50k.
#BTC #BTCUSDT
$HYPE 4H, we are seeing a strong impulse followed by distribution below the 33–35 area. The price is now compressed below a descending trend line and is losing momentum.
The 24.5–26 zone is the key technical area: everything will be decided there. A clean reaction could build a base and give room for a new bullish attempt. A net loss, on the other hand, would completely change the picture.
This is a transition phase, not one of anticipation. The only thing that matters is where the structure is confirmed.
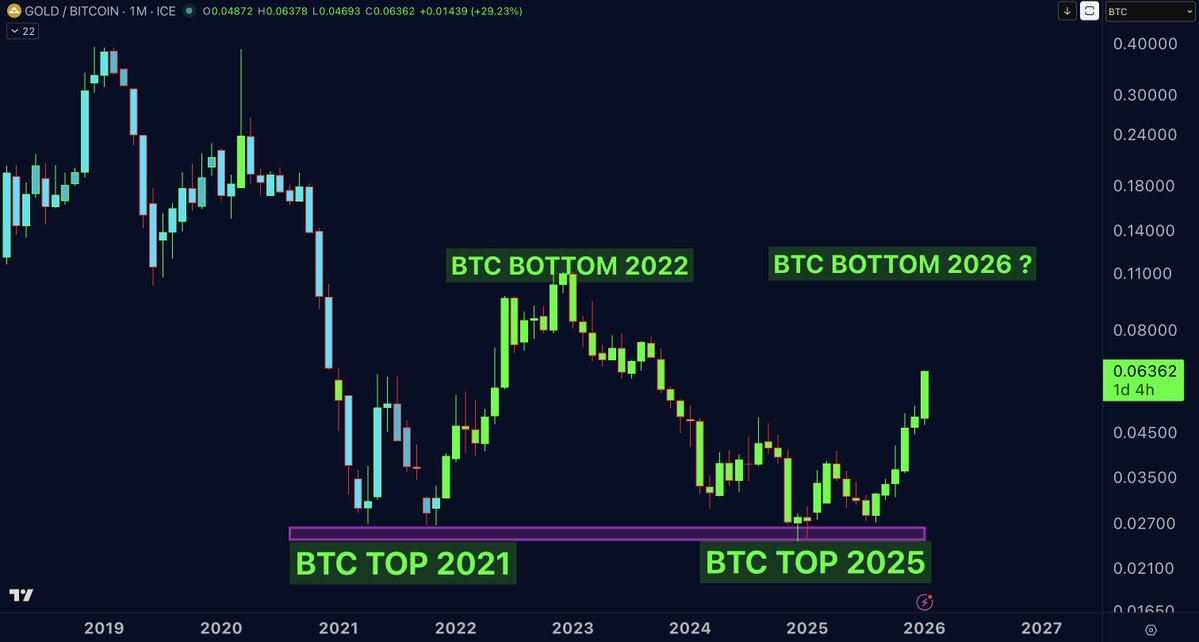
VERY IMPORTANT CHART 🚨
I have shared this $GOLD/ $BTC chart almost a year ago, pointing out that once 0.02 Bitcoin equal 1 gold ounce, it should be considered the top for BTC, and 0.11 BTC equal 1 gold ounce should be considered the bottom for BTC! This happened in 2021 during the Bitcoin top, and during the Bitcoin bottom in 2022. Again, my analysis proved right this year by calling the Bitcoin top at $125,000 at a price of 0,02 BTC for one Gold ounce! Will we see the Bitcoin bottom again at 0.11 BTC for one Gold ounce ?
If we do the math, 1 BTC = $5,500 (gold price) / 0.11 ≈ $50,000, which matches my analysis of Bitcoin’s bottom for this cycle between $50k–$60k. It is playing out exactly as expected. If we calculate with a gold price of $7,000, the equivalent BTC bottom comes in around $63,000, which also aligns with my bottom target. In my opinion, Gold will continue to outperform BTC in the coming months.
This is no financial advice and educational content only